The approximation shortcut
Inference for Categorical Data in R

Andrew Bray
Assistant Professor of Statistics at Reed College
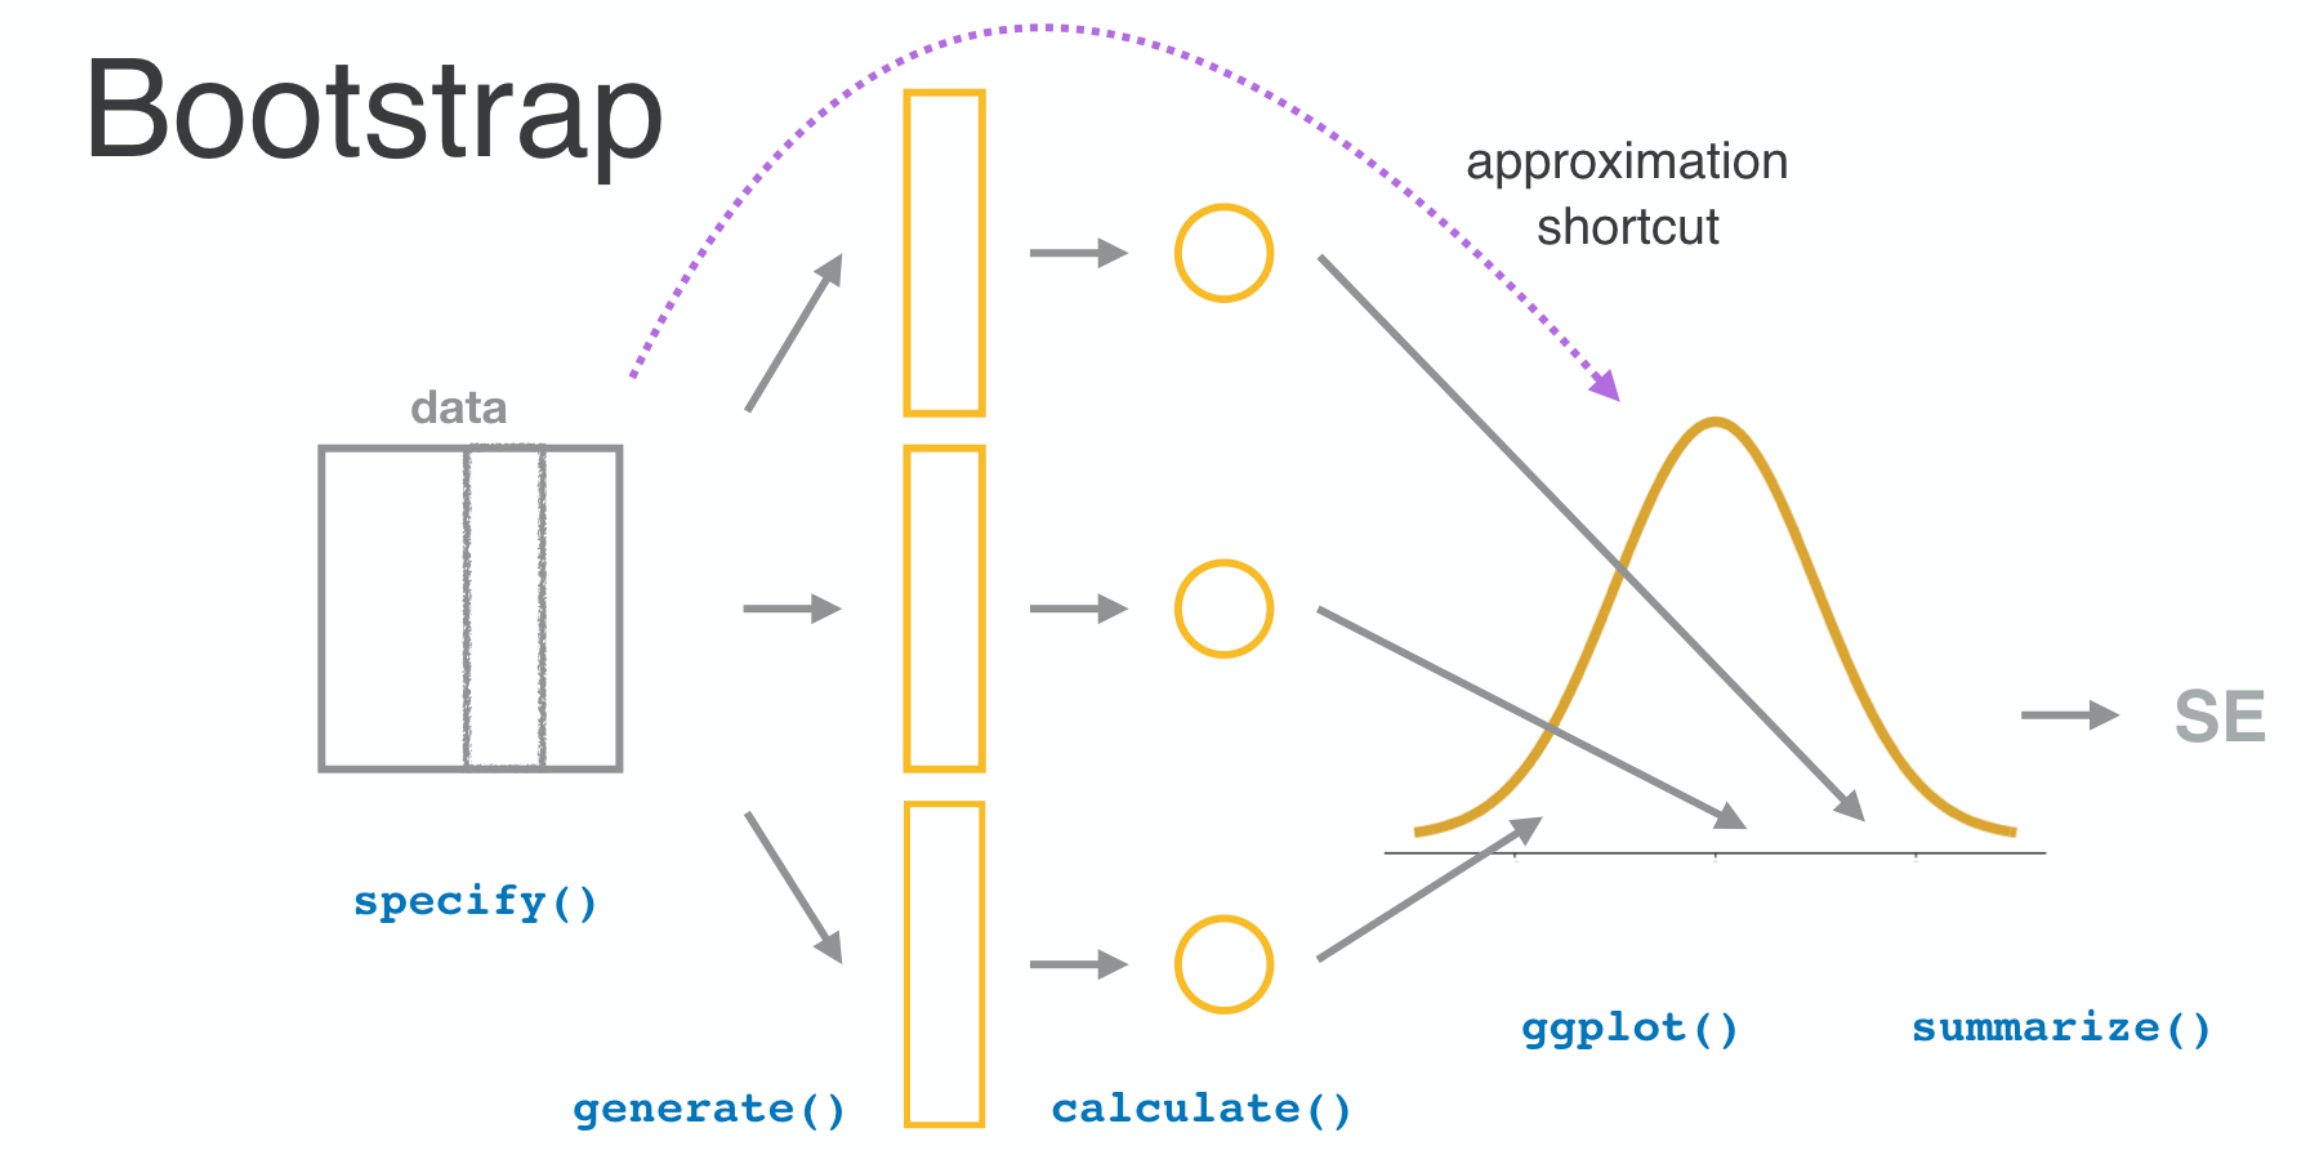
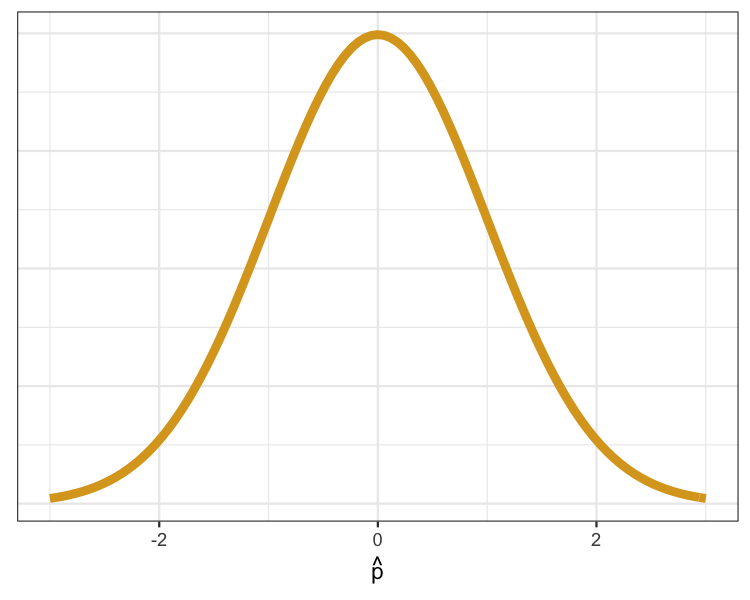
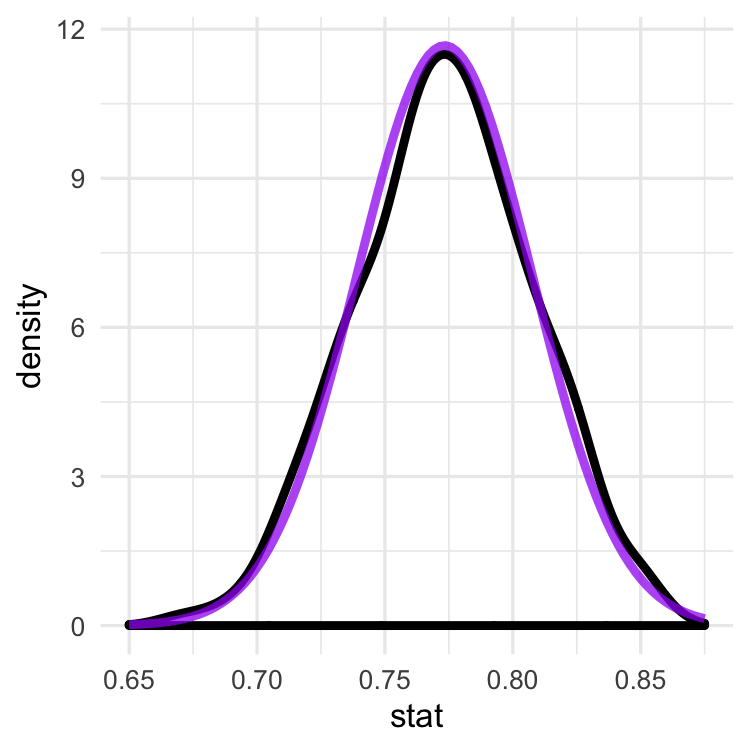
The normal distribution
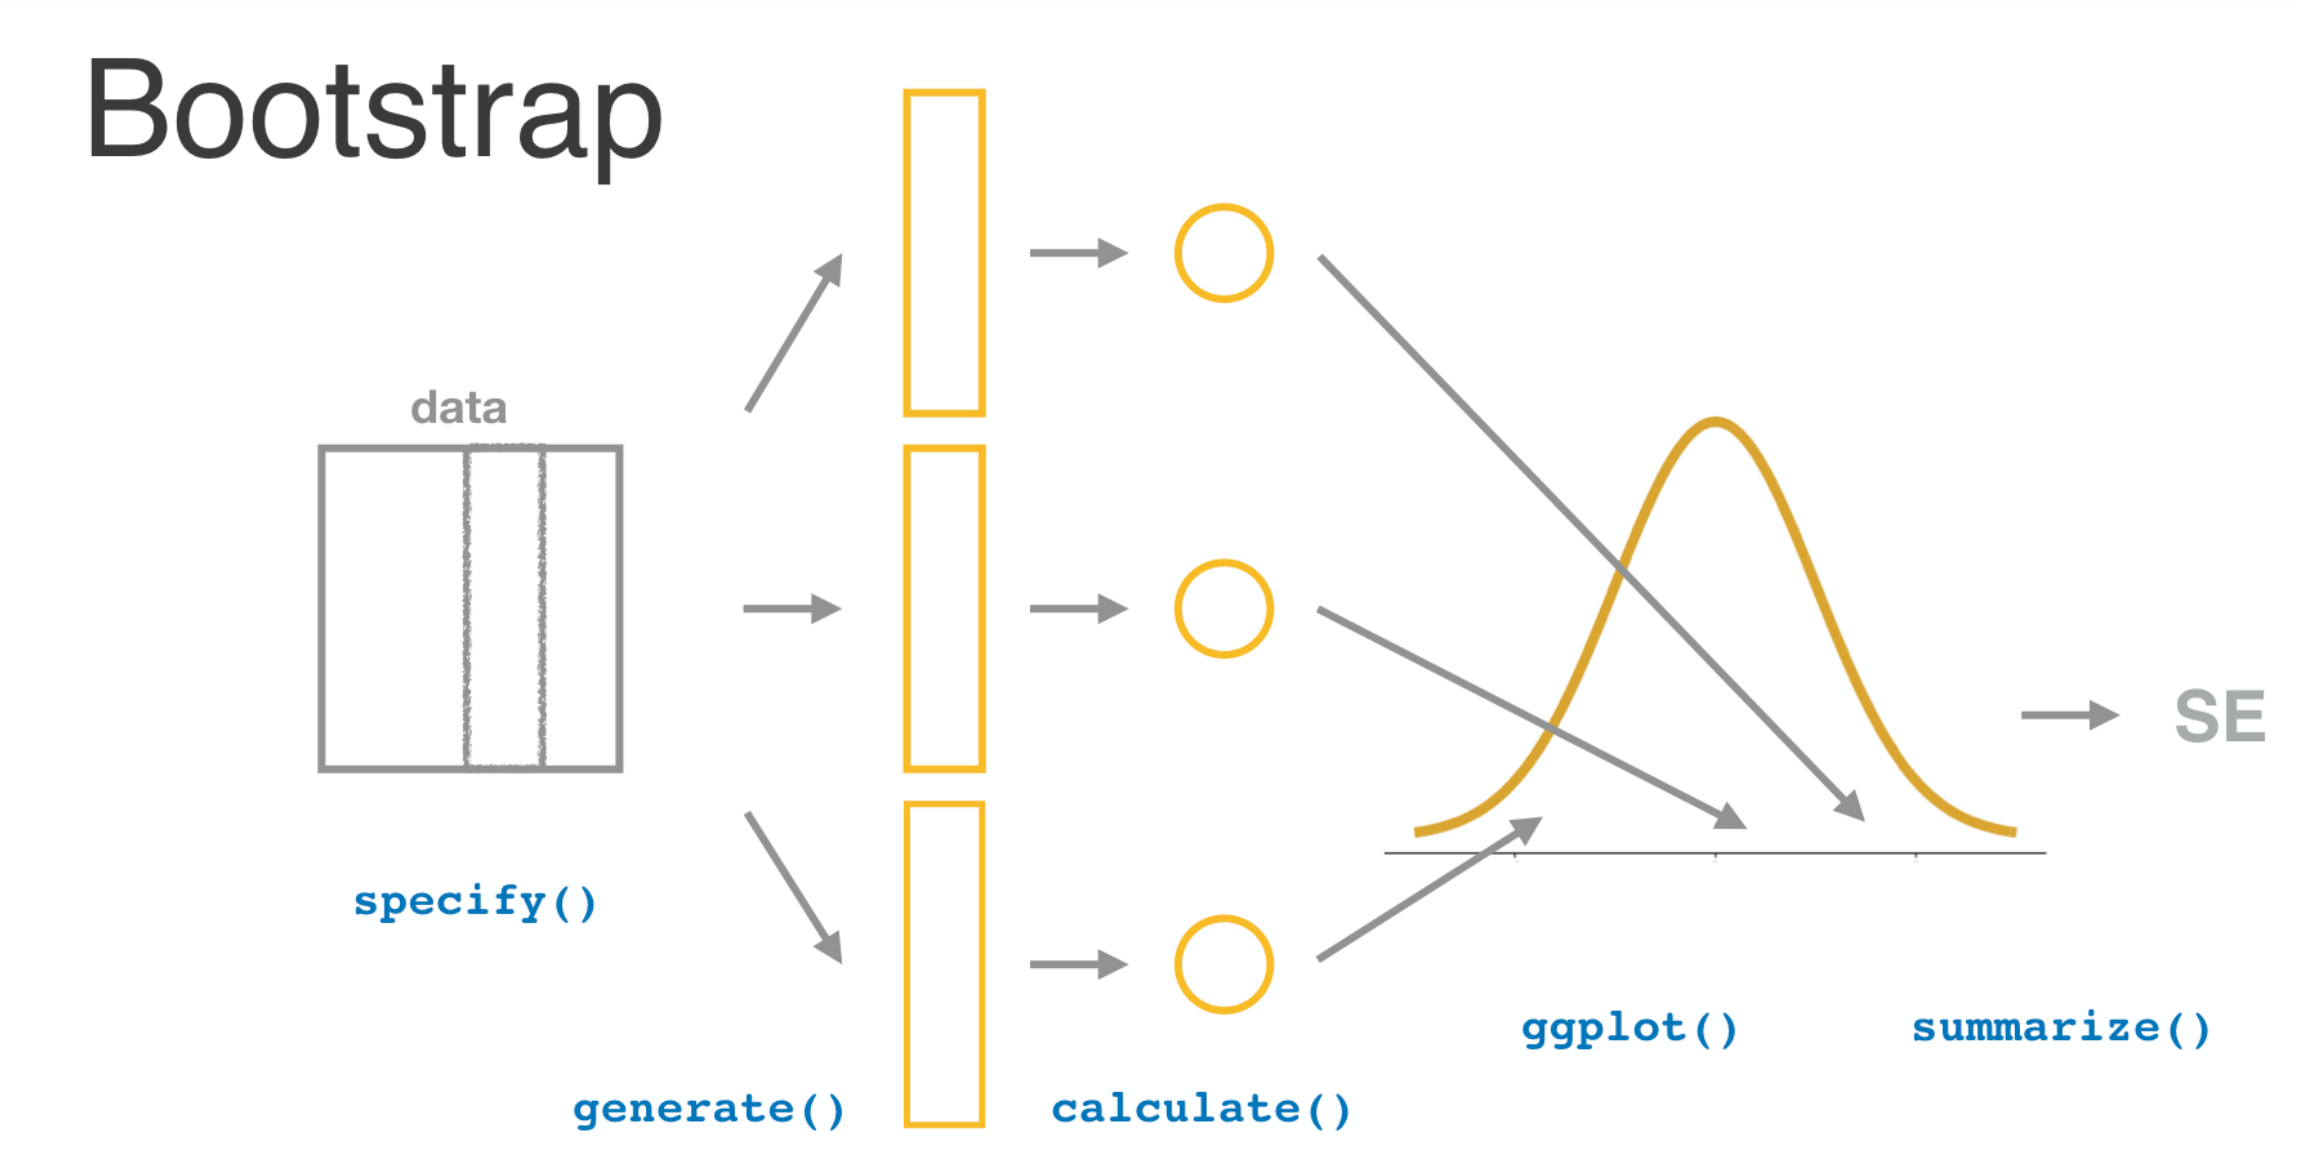
Sampling distributions
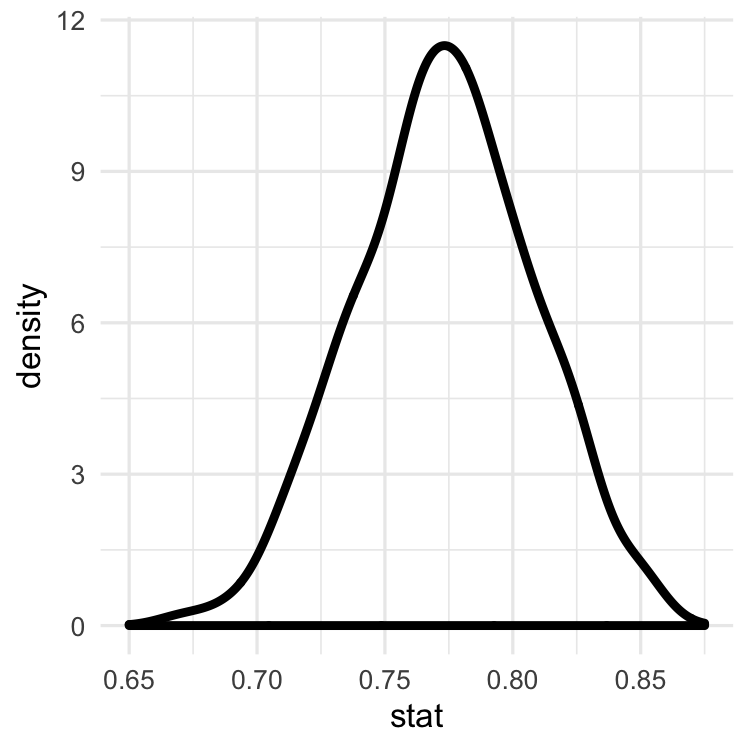
Sampling distributions
Sampling distributions
Inference for Categorical Data in R
Andrew Bray
Assistant Professor of Statistics at Reed College

