Intervals for differences
Inference for Categorical Data in R

Andrew Bray
Assistant Professor of Statistics at Reed College
Do women and men have different opinions on life after death?
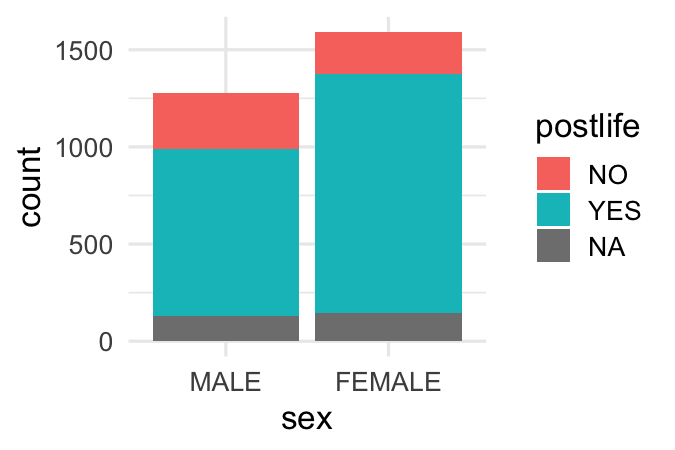
Do women and men have different opinions on life after death?
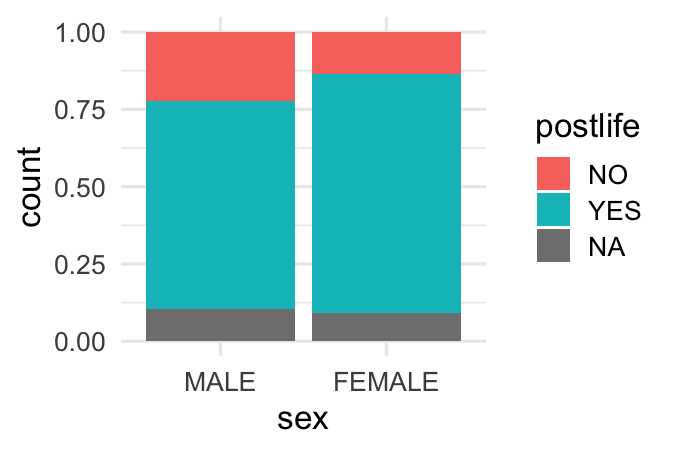
Do women and men have different opinions on life after death?