Alternate method: the chi-squared distribution
Inference for Categorical Data in R

Andrew Bray
Assistant Professor of Statistics at Reed College
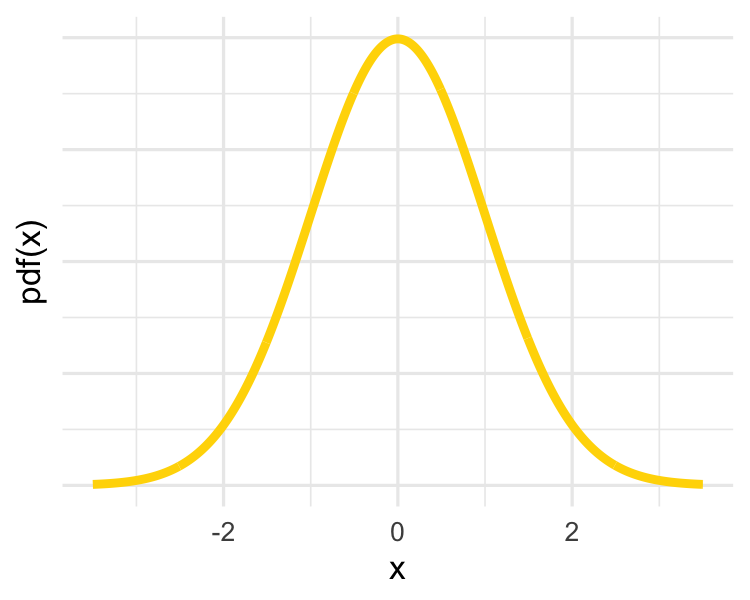
Approximation distributions: normal
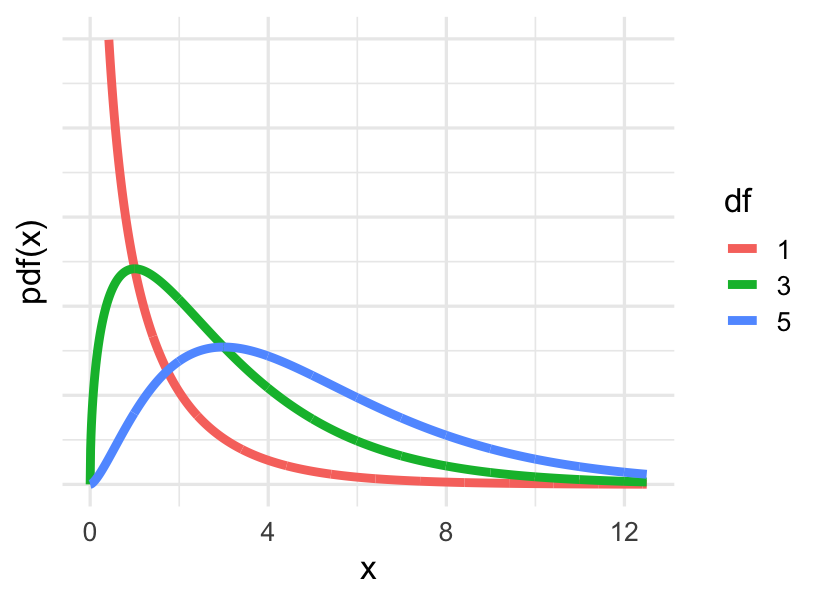
Approximation distributions: chi-squared
H-test via approximation
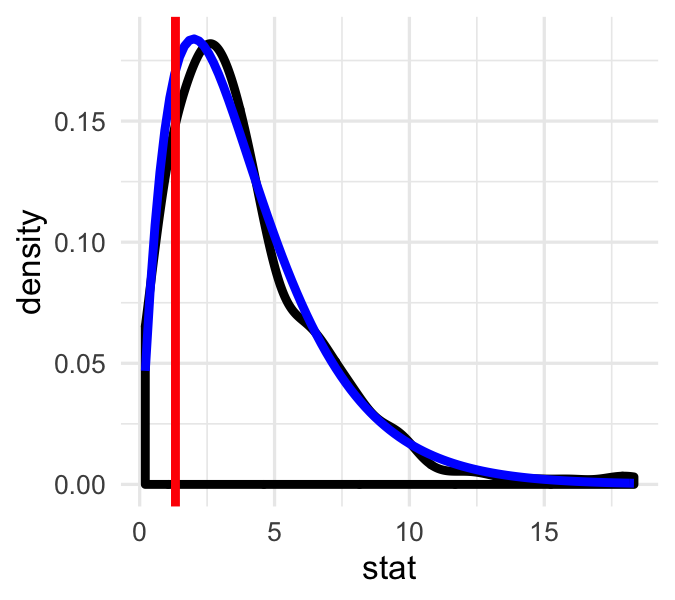
H-test via approximation
The chi-squared distribution

