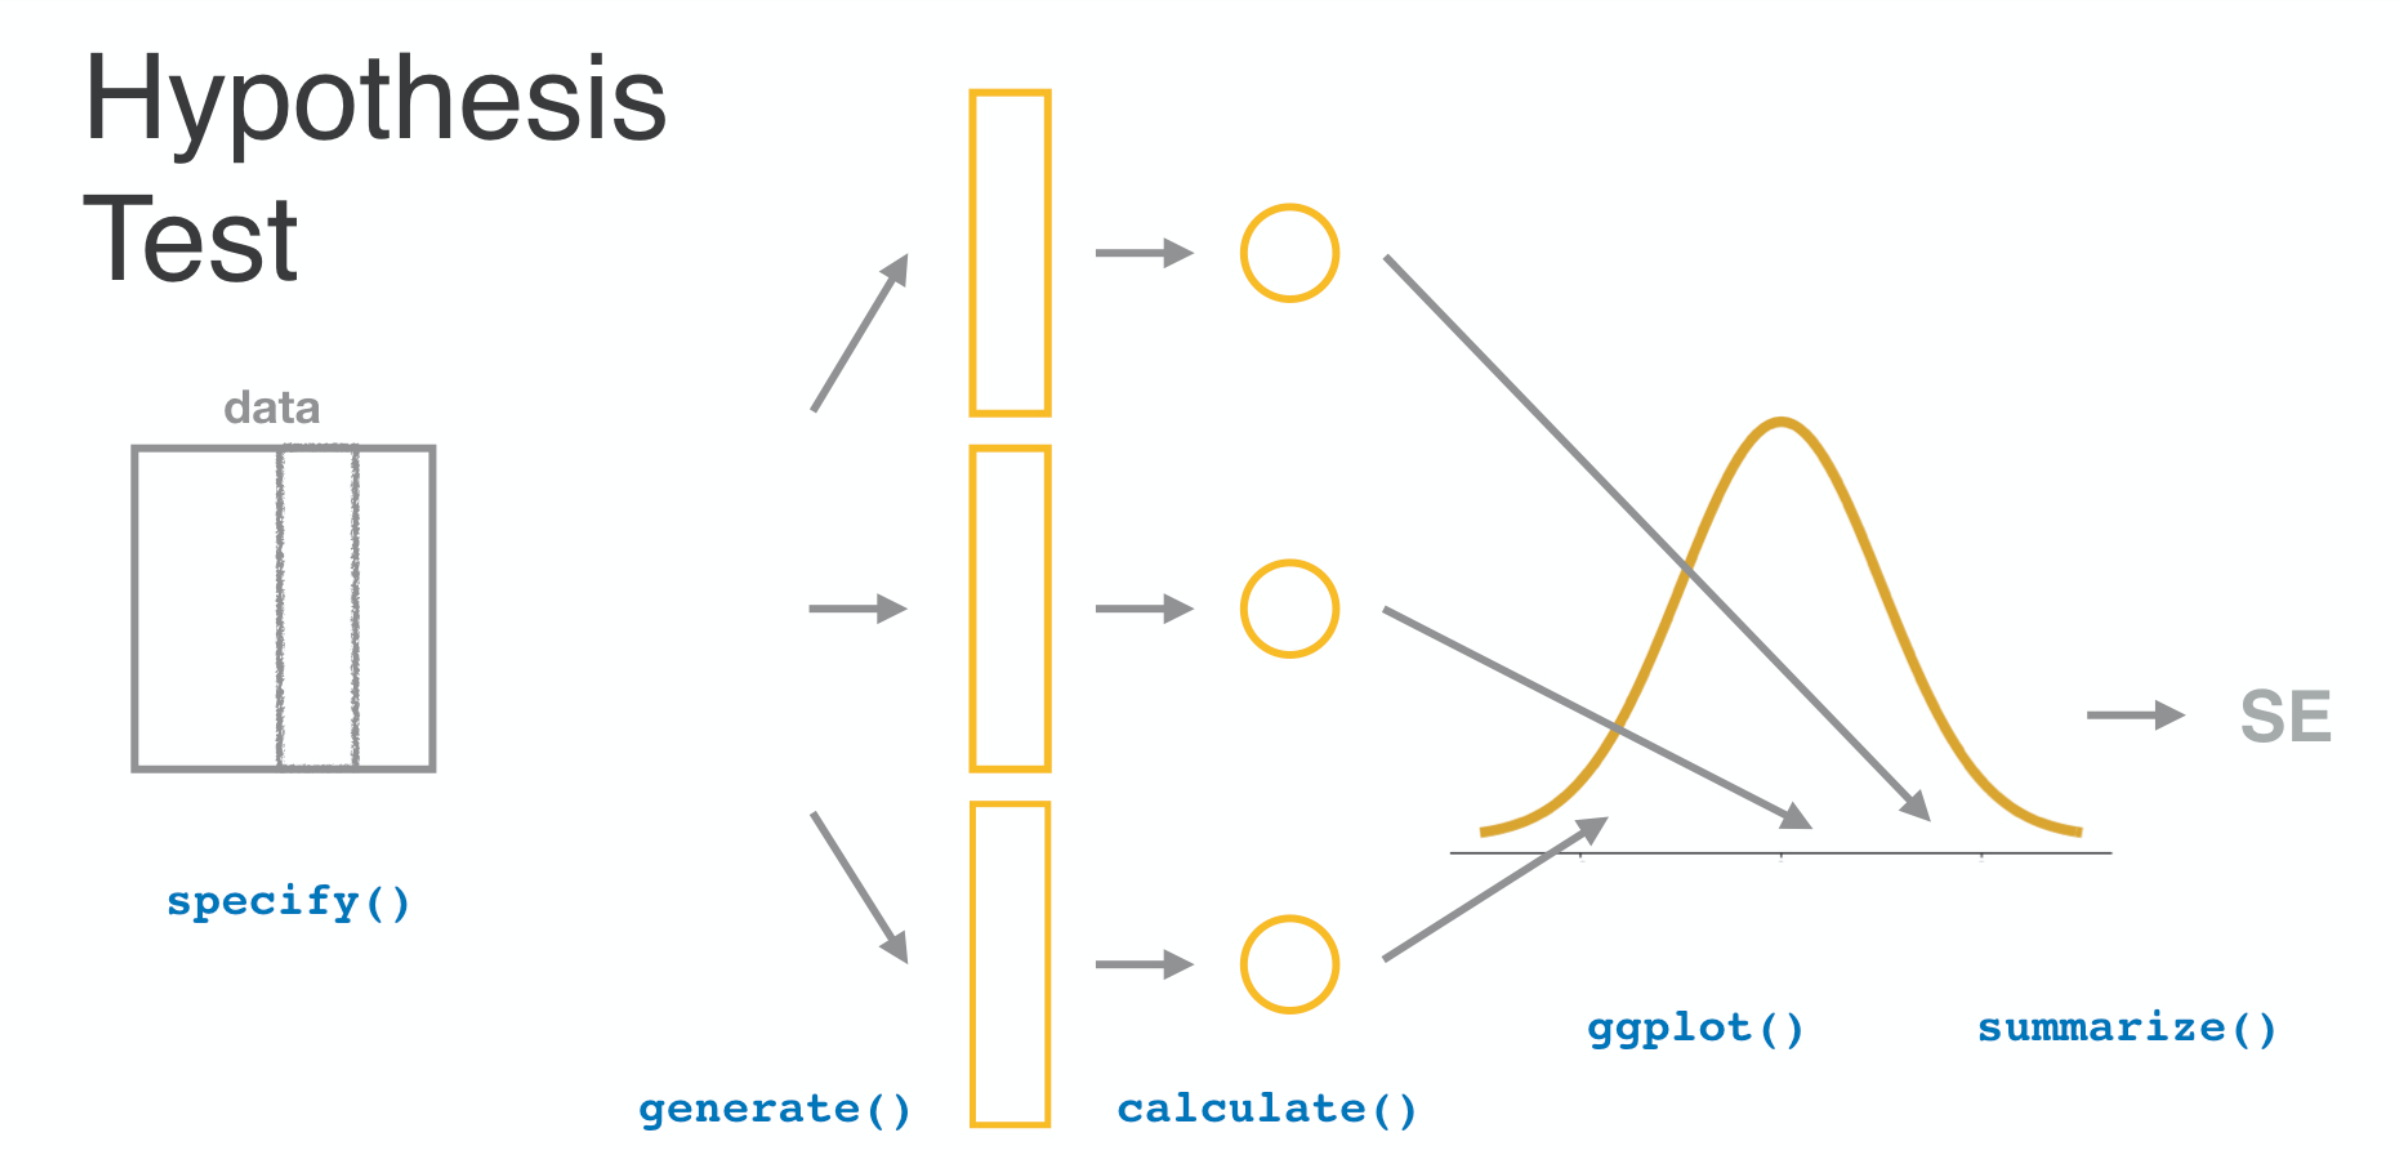
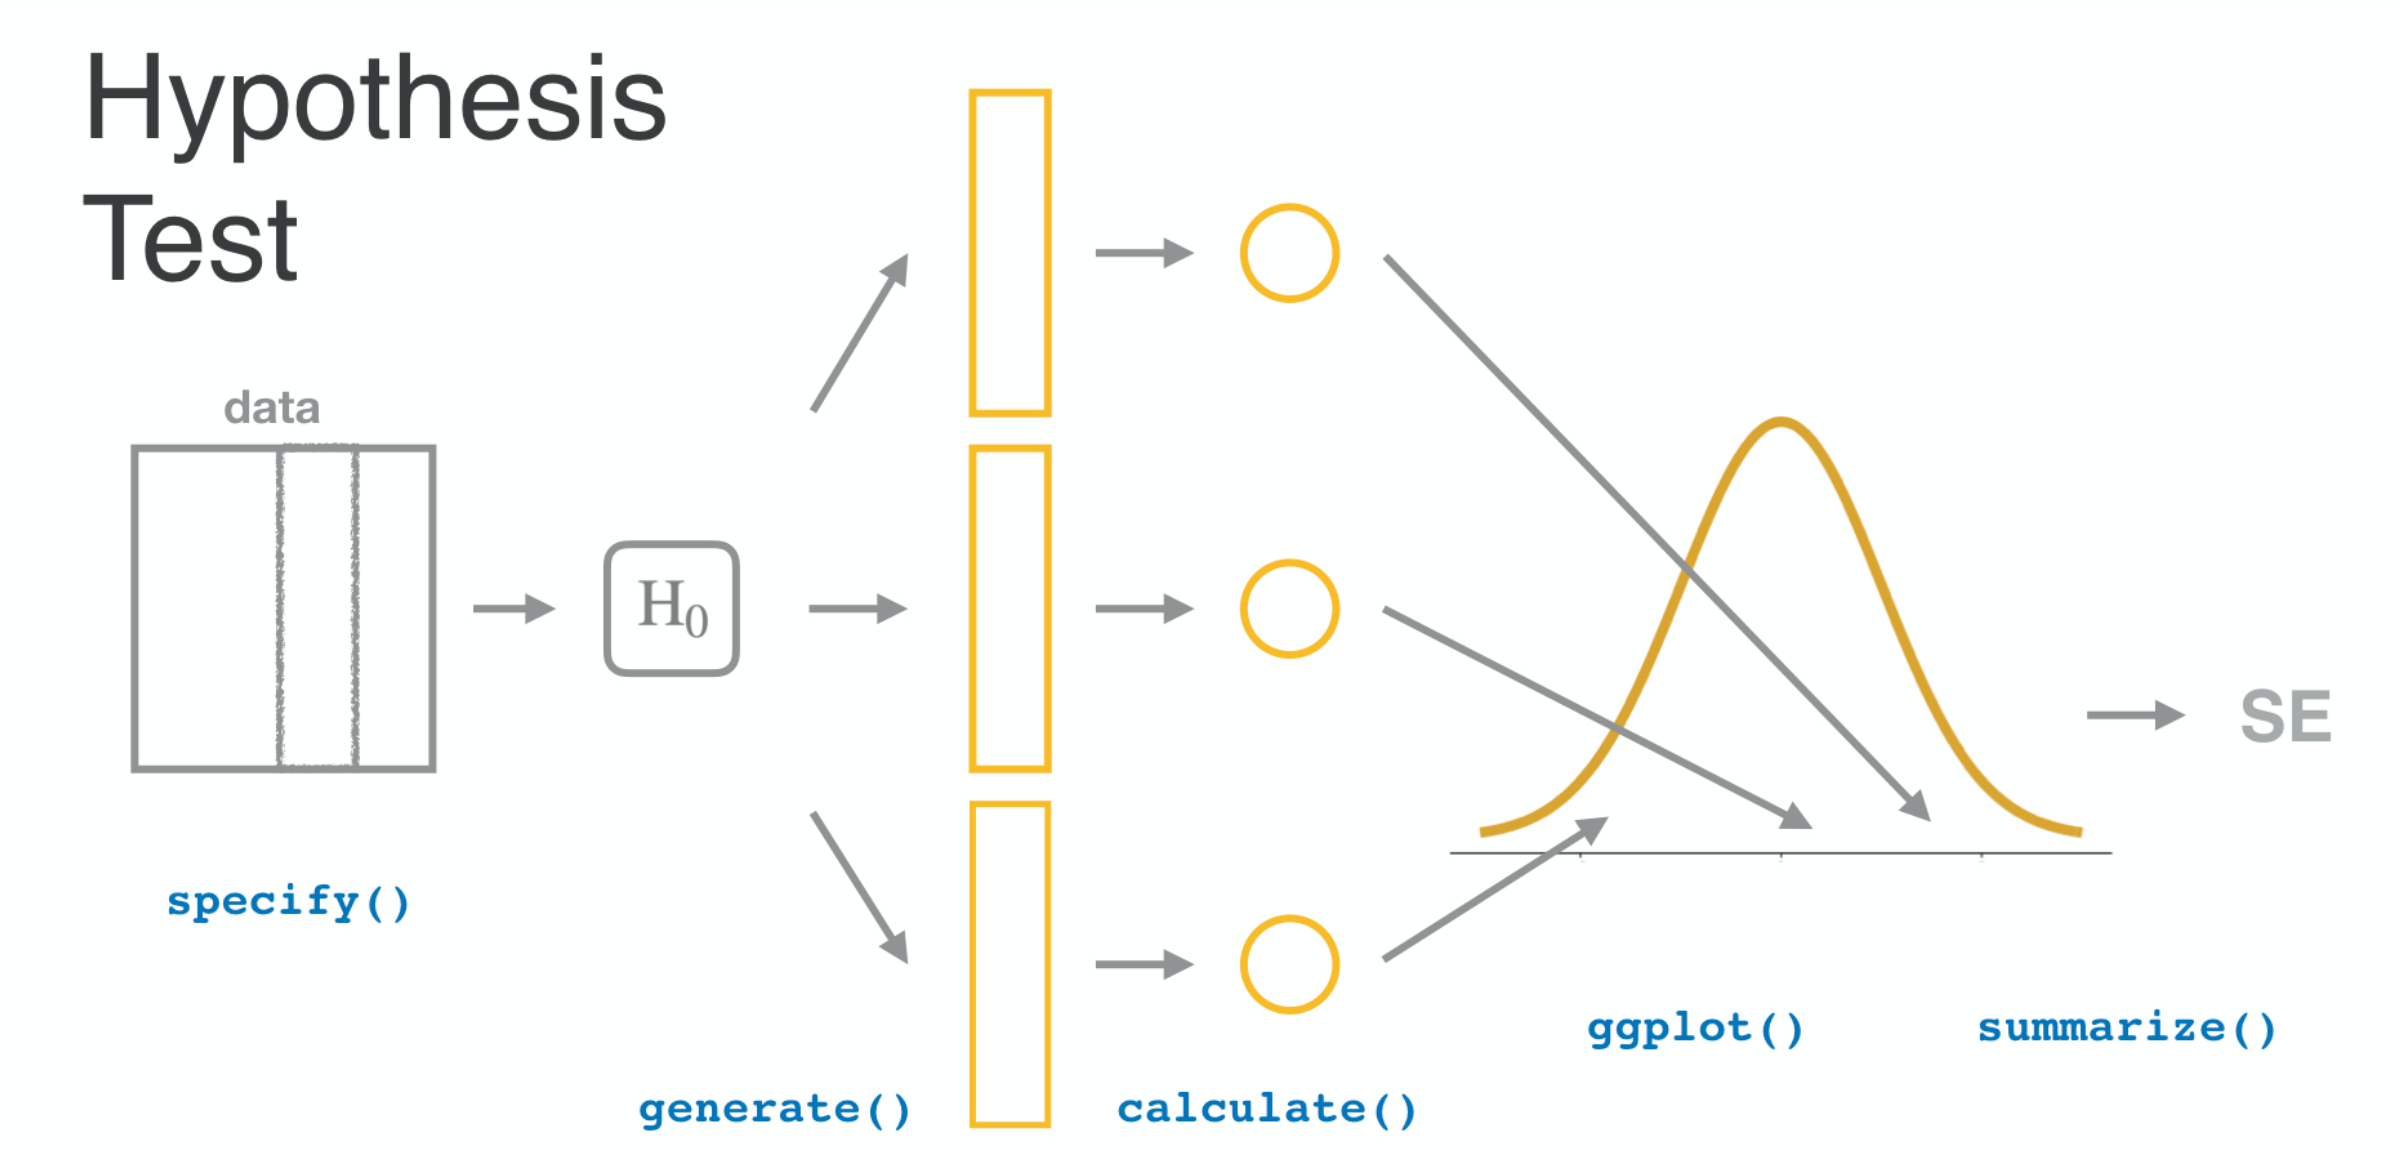
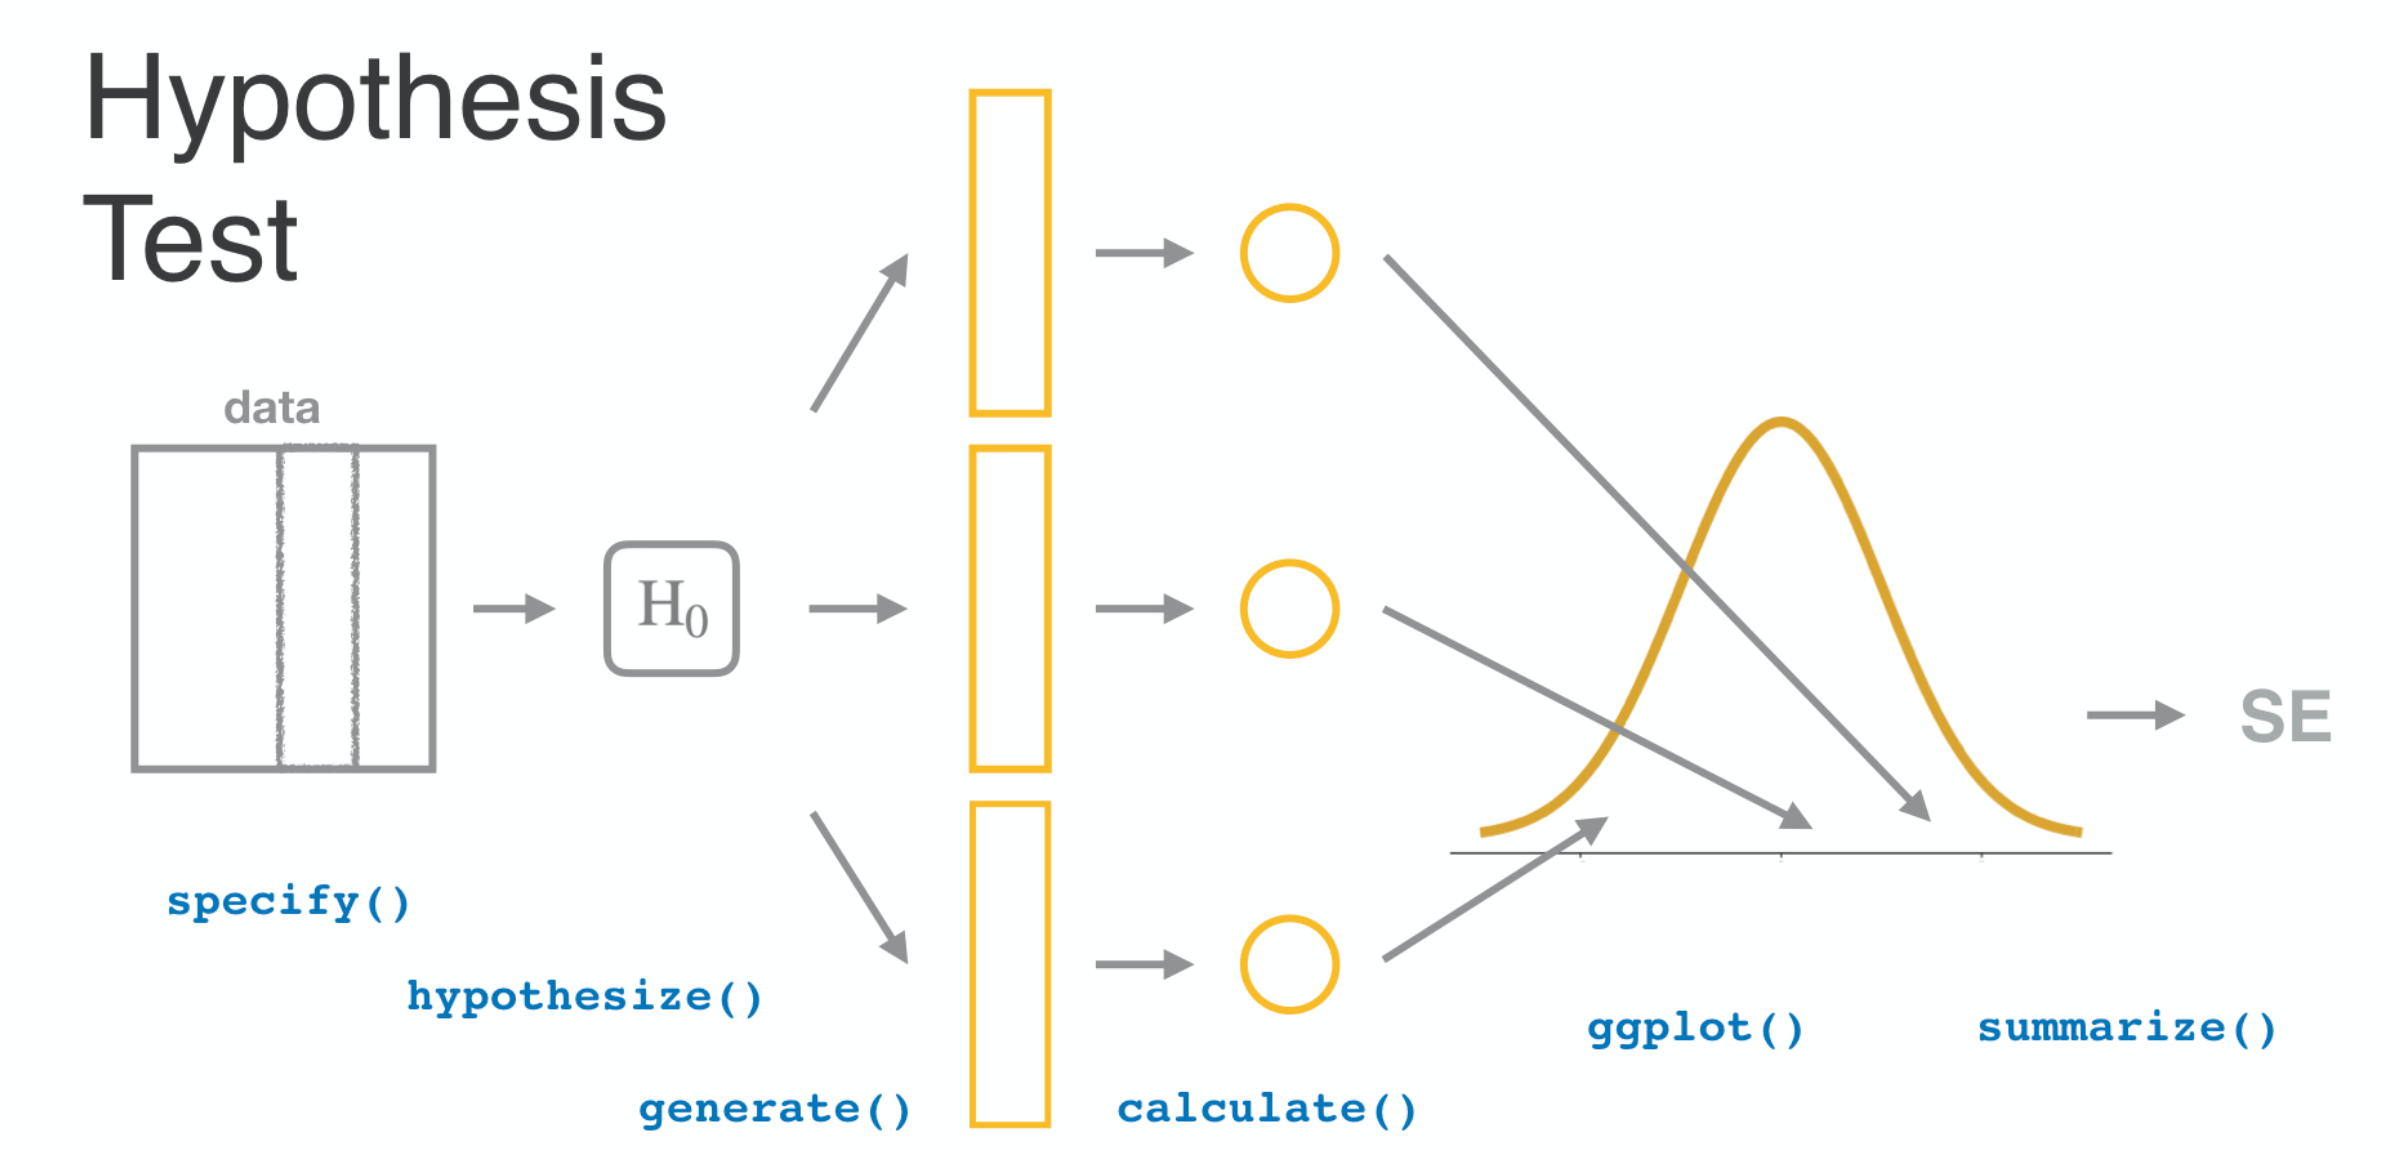
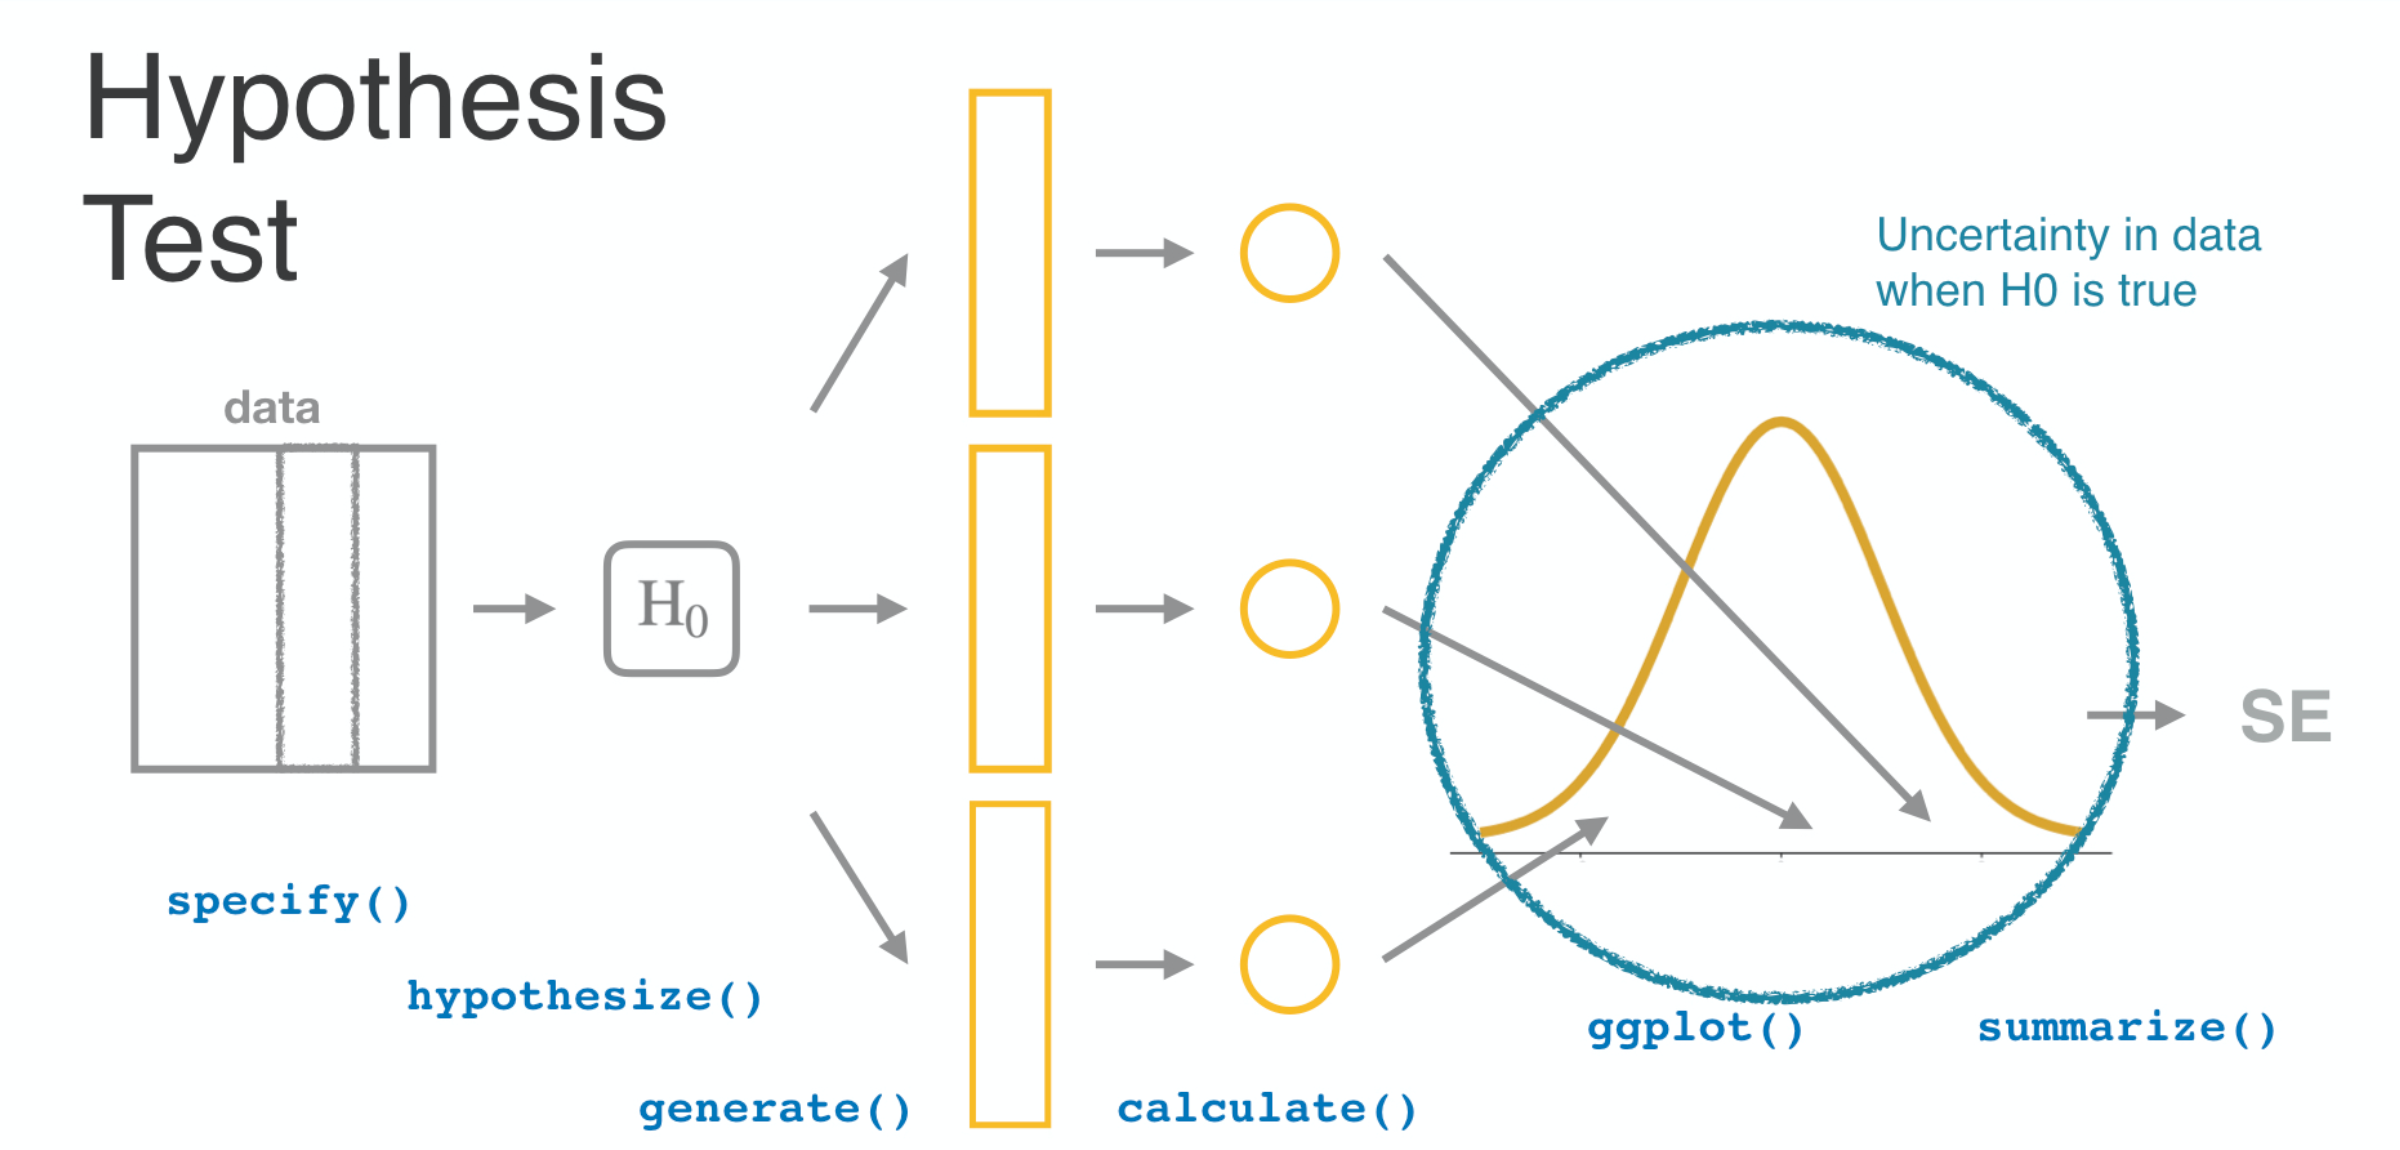
Hypothesis test for a proportion
Inference for Categorical Data in R

Andrew Bray
Assistant Professor of Statistics at Reed College


Do half of Americans favor capital punishment?
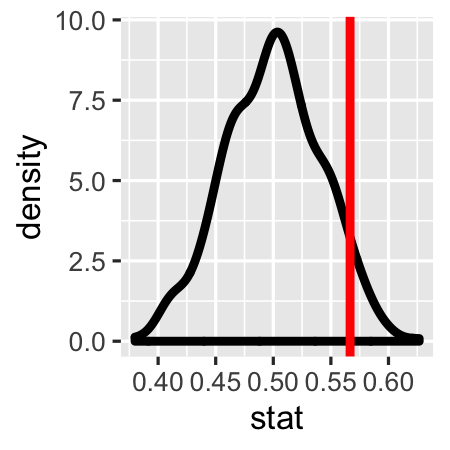
Do half of Americans favor capital punishment?
Inference for Categorical Data in R
Andrew Bray
Assistant Professor of Statistics at Reed College

