Chi-squared test statistic
Inference for Categorical Data in R

Andrew Bray
Assistant Professor of Statistics at Reed College
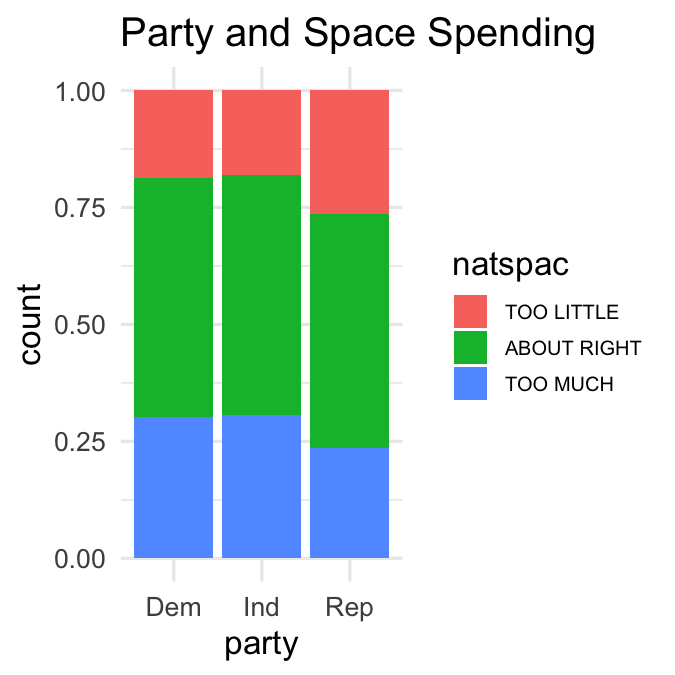
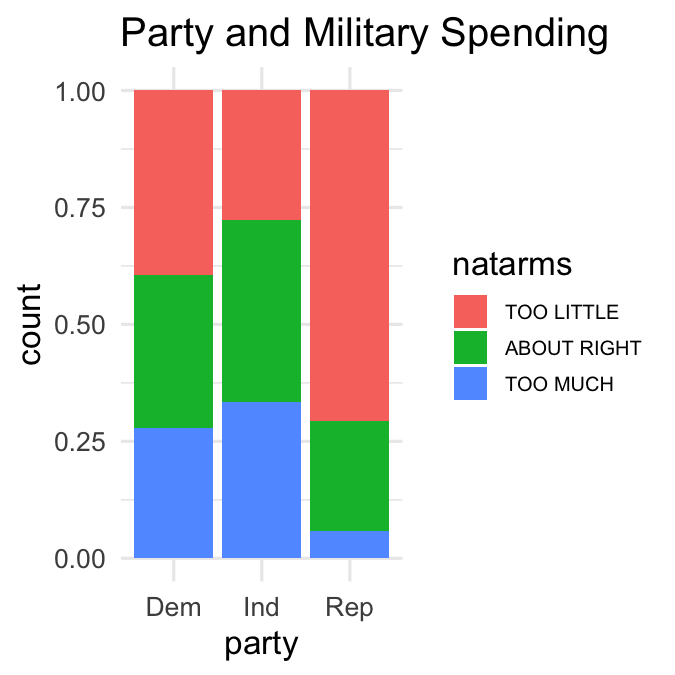
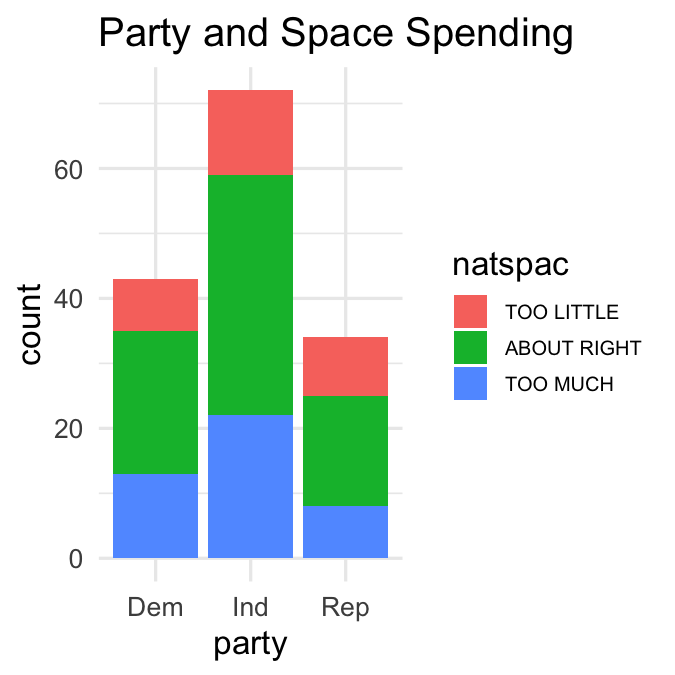
Comparing bar plots
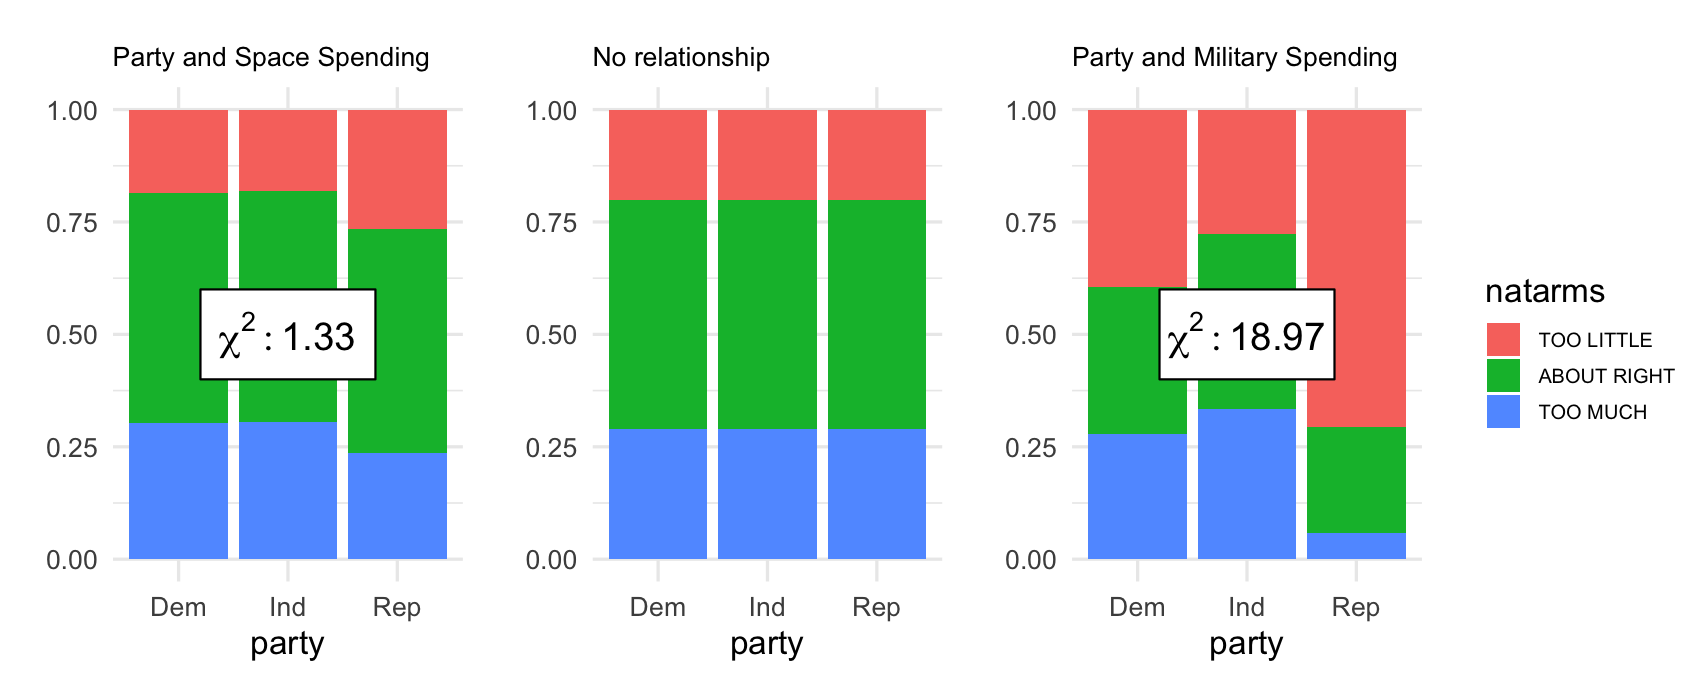
Choosing a statistic
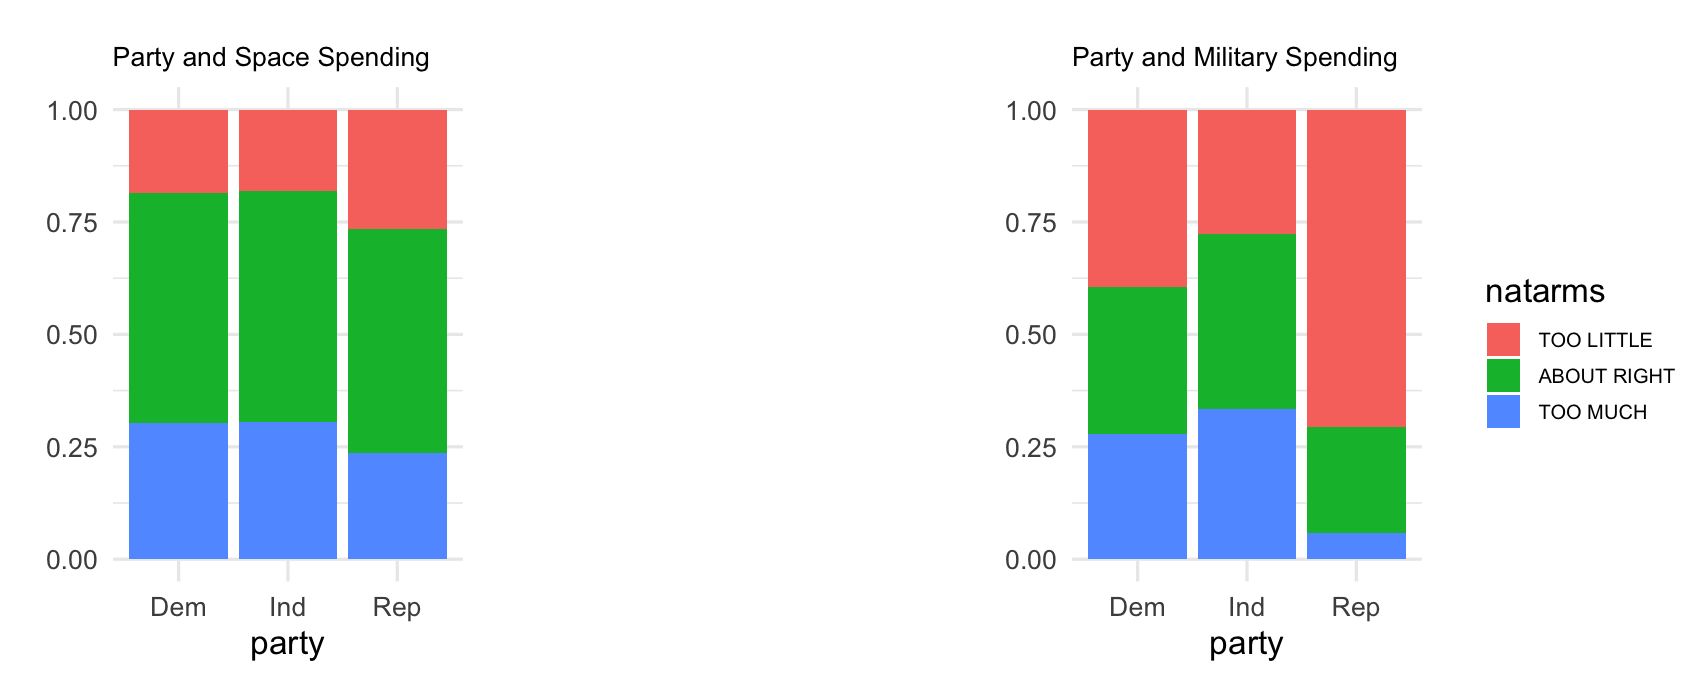
Choosing a statistic
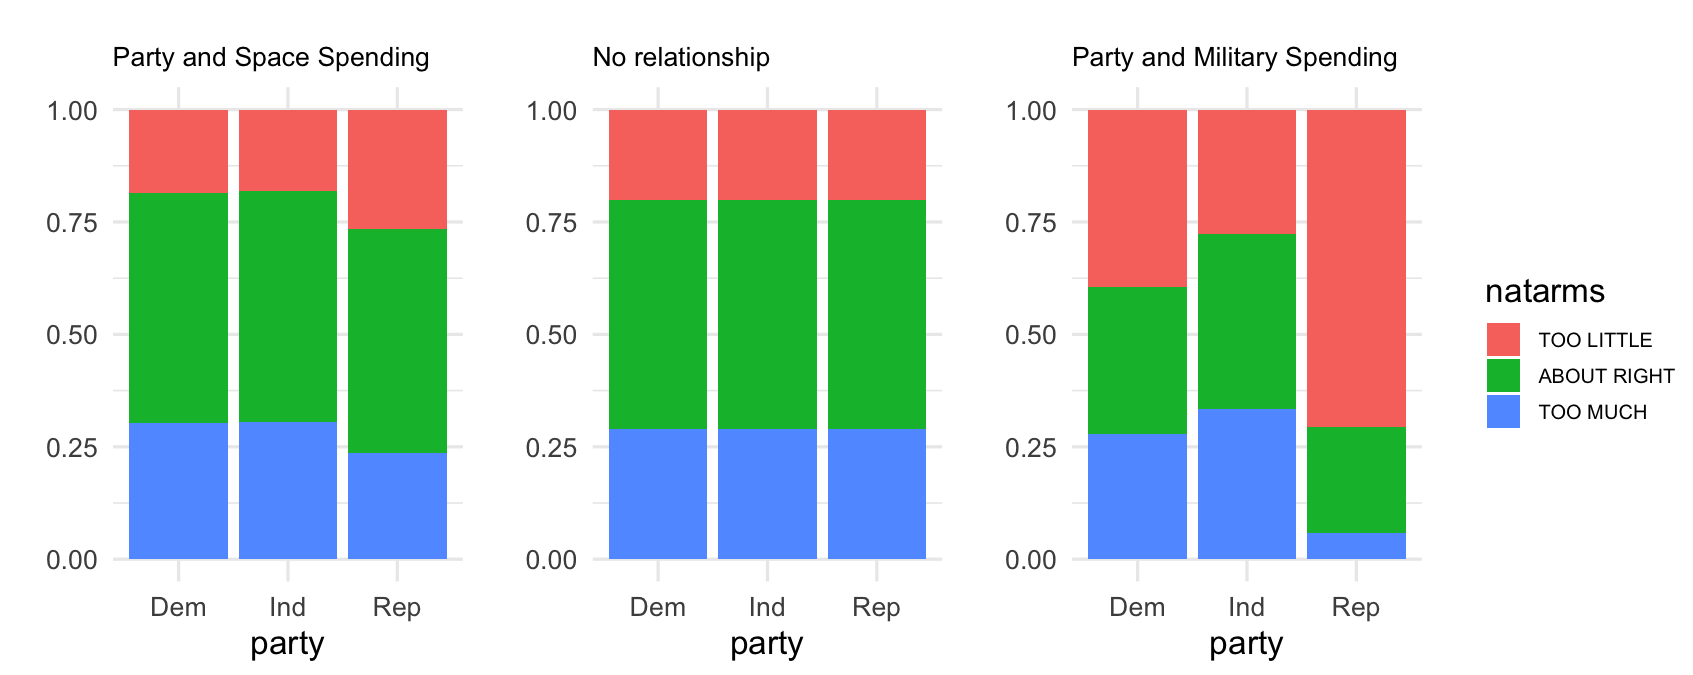
Choosing a statistic
Chi-squared distance
Inference for Categorical Data in R
Andrew Bray
Assistant Professor of Statistics at Reed College

