Введение в регрессию с statsmodels на Python
Maarten Van den Broeck
Content Developer at DataCamp
| n_claims | total_payment_sek |
|---|---|
| 108 | 392.5 |
| 19 | 46.2 |
| 13 | 15.7 |
| 124 | 422.2 |
| 40 | 119.4 |
| ... | ... |
import pandas as pd
print(swedish_motor_insurance.mean())
n_claims 22.904762
total_payment_sek 98.187302
dtype: float64
print(swedish_motor_insurance['n_claims'].corr(swedish_motor_insurance['total_payment_sek']))
0.9128782350234068
| n_claims | total_payment_sek |
|---|---|
| 108 | 3925 |
| 19 | 462 |
| 13 | 157 |
| 124 | 4222 |
| 40 | 1194 |
| 200 | ??? |
Переменная, значение которой нужно предсказать.
Переменные, которые объясняют изменение целевой переменной.
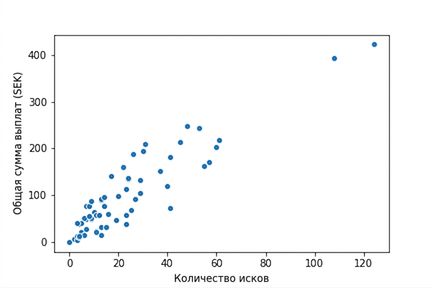
import matplotlib.pyplot as plt
import seaborn as sns
sns.scatterplot(x="n_claims",
y="total_payment_sek",
data=swedish_motor_insurance)
plt.show()

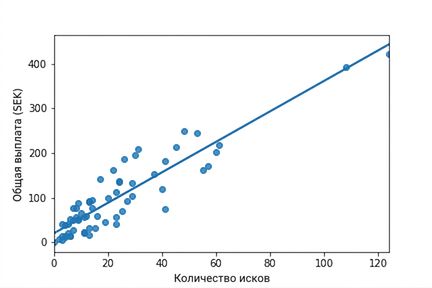
sns.regplot(x="n_claims",
y="total_payment_sek",
data=swedish_motor_insurance,
ci=None)

Визуализация и построение моделей линейной регрессии.
Прогнозирование на основе линейной регрессии и интерпретация коэффициентов модели.
Оценка качества модели линейной регрессии.
То же самое, но для моделей логистической регрессии.
statsmodelsscikit-learnВведение в регрессию с statsmodels на Python