import pandas as pd

df = pd.read_csv("masculinity.csv")

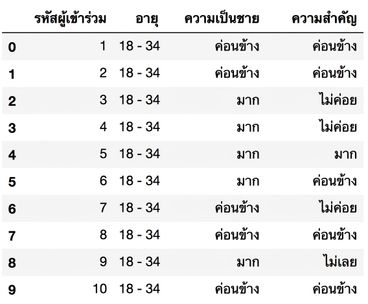
df.head()
    participant_id        age    how_masculine    how_important
0                1    18 - 34         Somewhat         Somewhat
1                2    18 - 34         Somewhat         Somewhat
2                3    18 - 34             Very         Not very
3                4    18 - 34             Very         Not very
4                5    18 - 34             Very             Very
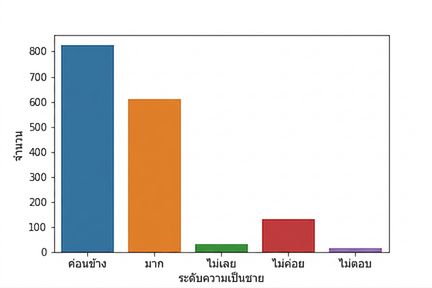
การใช้ DataFrame กับ countplot()
import pandas as pd
import matplotlib.pyplot as plt
import seaborn as sns

df = pd.read_csv("masculinity.csv")

sns.countplot(x="how_masculine",
              data=df)

plt.show()