การสร้างภาพข้อมูลด้วย Seaborn เบื้องต้น
Content Team
DataCamp


กราฟ Seaborn สร้างออบเจ็กต์ 2 ประเภท ได้แก่ FacetGrid และ AxesSubplot
g = sns.scatterplot(x="height", y="weight", data=df)type(g)
> matplotlib.axes._subplots.AxesSubplot

| ประเภทออบเจ็กต์ | ประเภทกราฟ | ลักษณะเฉพาะ |
|---|---|---|
FacetGrid |
relplot(), catplot() |
สร้าง subplot ได้ |
AxesSubplot |
scatterplot(), countplot(), ฯลฯ |
สร้างกราฟได้เพียงกราฟเดียว |
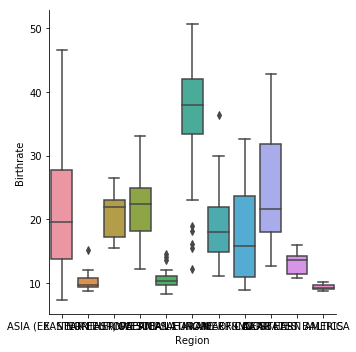
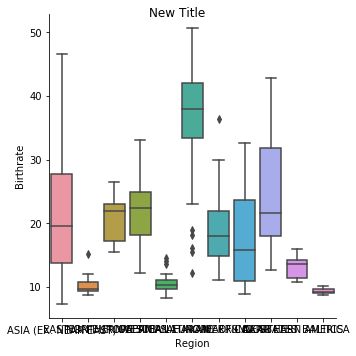
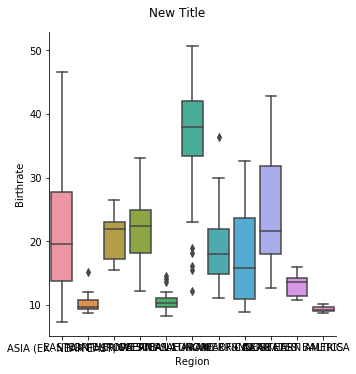
g = sns.catplot(x="Region", y="Birthrate", data=gdp_data, kind="box")g.figure.suptitle("New Title")plt.show()

g = sns.catplot(x="Region",
y="Birthrate",
data=gdp_data,
kind="box")
g.figure.suptitle("New Title",
y=1.03)
plt.show()

การสร้างภาพข้อมูลด้วย Seaborn เบื้องต้น