การแชร์การแสดงผลข้อมูลให้ผู้อื่น

การสร้างภาพข้อมูลด้วย Matplotlib เบื้องต้น

Ariel Rokem

Data Scientist

กราฟที่พร้อมแชร์

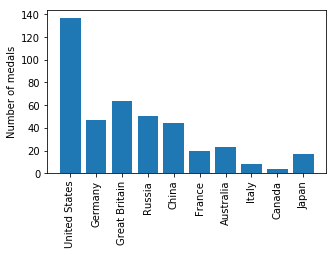
fig, ax = plt.subplots()

ax.bar(medals.index, medals["Gold"])
ax.set_xticklabels(medals.index, rotation=90)
ax.set_ylabel("Number of medals")

plt.show()
การสร้างภาพข้อมูลด้วย Matplotlib เบื้องต้น

บันทึกกราฟลงไฟล์

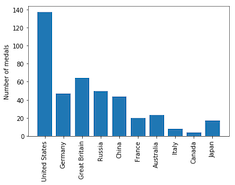
fig, ax = plt.subplots()

ax.bar(medals.index, medals["Gold"])
ax.set_xticklabels(medals.index, rotation=90)
ax.set_ylabel("Number of medals")

fig.savefig("gold_medals.png")
ls
gold_medals.png
การสร้างภาพข้อมูลด้วย Matplotlib เบื้องต้น

รูปแบบไฟล์ที่รองรับ

fig.savefig("gold_medals.jpg")
fig.savefig("gold_medals.jpg", quality=50)
fig.savefig("gold_medals.svg")
การสร้างภาพข้อมูลด้วย Matplotlib เบื้องต้น

ความละเอียด

fig.savefig("gold_medals.png", dpi=300)
การสร้างภาพข้อมูลด้วย Matplotlib เบื้องต้น

ขนาด

fig.set_size_inches([5, 3])

การสร้างภาพข้อมูลด้วย Matplotlib เบื้องต้น

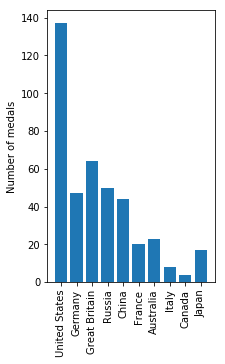
สัดส่วนภาพแบบอื่น

fig.set_size_inches([3, 5])
การสร้างภาพข้อมูลด้วย Matplotlib เบื้องต้น

มาฝึกบันทึกการแสดงผลข้อมูลกันเถอะ!

การสร้างภาพข้อมูลด้วย Matplotlib เบื้องต้น

Preparing Video For Download...