การแสดงผลข้อมูลด้วย Matplotlib เบื้องต้น

การสร้างภาพข้อมูลด้วย Matplotlib เบื้องต้น

Ariel Rokem

Data Scientist

การแสดงผลข้อมูล
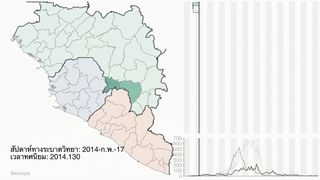
Image credit: Gytis Dudas and Andrew Rambaut

การสร้างภาพข้อมูลด้วย Matplotlib เบื้องต้น

แนะนำ pyplot interface

import matplotlib.pyplot as plt

fig, ax = plt.subplots()
plt.show()

การสร้างภาพข้อมูลด้วย Matplotlib เบื้องต้น

การเพิ่มข้อมูลลงใน axes

seattle_weather["MONTH"]
DATE
1     Jan
2     Feb
3     Mar
4     Apr
5     May
6     Jun
7     Jul
8     Aug
9     Sep
10    Oct
11    Nov
12    Dec
Name: MONTH, dtype: object
seattle_weather["MLY-TAVG-NORMAL"]
1     42.1
2     43.4
3     46.6
4     50.5
5     56.0
6     61.0
7     65.9
8     66.5
9     61.6
10    53.3
11    46.2
12    41.1
Name: MLY-TAVG-NORMAL, dtype: float64
การสร้างภาพข้อมูลด้วย Matplotlib เบื้องต้น

การเพิ่มข้อมูลลงใน axes

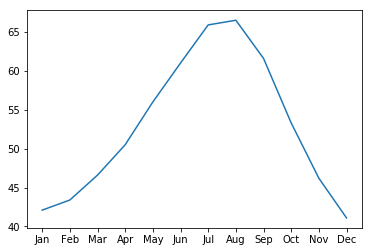
ax.plot(seattle_weather["MONTH"], seattle_weather["MLY-TAVG-NORMAL"])
plt.show()
การสร้างภาพข้อมูลด้วย Matplotlib เบื้องต้น

การเพิ่มข้อมูลเพิ่มเติม

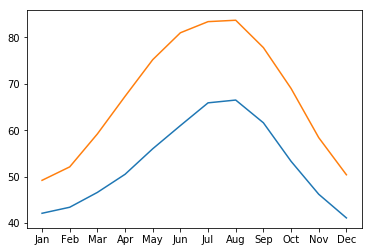
ax.plot(austin_weather["MONTH"], austin_weather["MLY-TAVG-NORMAL"])
plt.show()
การสร้างภาพข้อมูลด้วย Matplotlib เบื้องต้น

รวมทุกอย่างเข้าด้วยกัน

fig, ax = plt.subplots()
ax.plot(seattle_weather["MONTH"], seattle_weather["MLY-TAVG-NORMAL"])
ax.plot(austin_weather["MONTH"], austin_weather["MLY-TAVG-NORMAL"])
plt.show()

การสร้างภาพข้อมูลด้วย Matplotlib เบื้องต้น

มาฝึกสร้างกราฟกัน!

การสร้างภาพข้อมูลด้วย Matplotlib เบื้องต้น

Preparing Video For Download...