t-SNE สำหรับแผนที่ 2 มิติ

Unsupervised Learning ใน Python

Benjamin Wilson

Director of Research at lateral.io

t-SNE สำหรับแผนที่ 2 มิติ

  • t-SNE = "t-distributed stochastic neighbor embedding"
  • แมปตัวอย่างไปยังพื้นที่ 2D (หรือ 3D)
  • แผนที่รักษาความใกล้ชิดของตัวอย่างโดยประมาณ
  • เหมาะสำหรับการสำรวจชุดข้อมูล
Unsupervised Learning ใน Python

t-SNE กับชุดข้อมูล iris

  • ชุดข้อมูล Iris มี 4 การวัด ดังนั้นตัวอย่างจึงเป็น 4 มิติ
  • t-SNE แมปตัวอย่างไปยังพื้นที่ 2D
  • t-SNE ไม่รู้ว่ามีสายพันธุ์ที่แตกต่างกัน
  • ... แต่ยังคงแยกสายพันธุ์ออกจากกันได้เป็นส่วนใหญ่
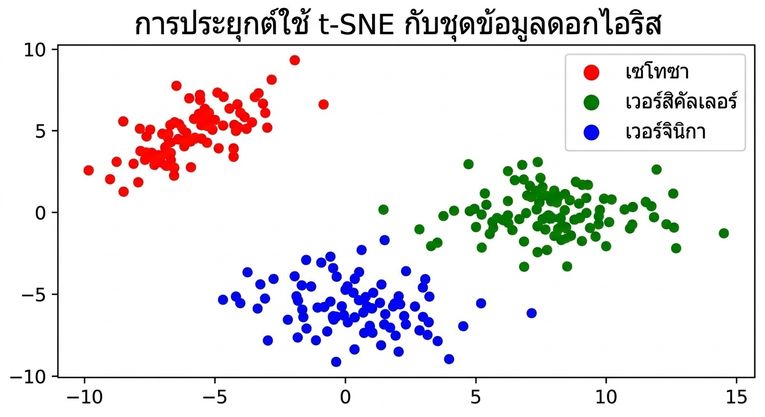
scatter plot ของ t-SNE ที่ใช้กับชุดข้อมูล Iris

Unsupervised Learning ใน Python

การตีความ scatter plot ของ t-SNE

  • "versicolor" และ "virginica" แยกแยะกันได้ยากกว่า
  • สอดคล้องกับกราฟ inertia ของ k-means: อาจแบ่งเป็น 2 หรือ 3 คลัสเตอร์ก็ได้

scatter plot ของ t-SNE ที่ใช้กับชุดข้อมูล Iris

Unsupervised Learning ใน Python

t-SNE ใน sklearn

  • NumPy array 2 มิติ samples
print(samples)
[[ 5.   3.3  1.4  0.2]
 [ 5.   3.5  1.3  0.3]
 [ 4.9  2.4  3.3  1. ]
 [ 6.3  2.8  5.1  1.5]
 ...
 [ 4.9  3.1  1.5  0.1]]
  • List species ระบุสายพันธุ์เป็นตัวเลข (0, 1 หรือ 2)
print(species)
[0, 0, 1, 2, ..., 0]
Unsupervised Learning ใน Python

t-SNE ใน sklearn

import matplotlib.pyplot as plt
from sklearn.manifold import TSNE
model = TSNE(learning_rate=100)

transformed = model.fit_transform(samples) xs = transformed[:,0] ys = transformed[:,1] plt.scatter(xs, ys, c=species) plt.show()
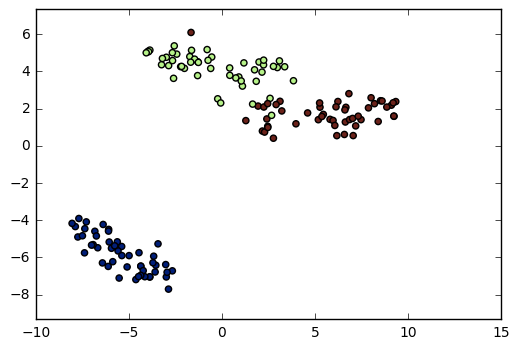
scatter plot ของ t-SNE ที่ใช้กับชุดข้อมูล Iris

Unsupervised Learning ใน Python

t-SNE มีเพียง fit_transform()

  • มีเมธอด fit_transform()
  • ฟิตโมเดลและแปลงข้อมูลในขั้นตอนเดียวกัน
  • ไม่มีเมธอด fit() หรือ transform() แยกต่างหาก
  • ไม่สามารถขยายแผนที่เพื่อรองรับตัวอย่างข้อมูลใหม่ได้
  • ต้องเริ่มต้นใหม่ทุกครั้ง!
Unsupervised Learning ใน Python

Learning rate ของ t-SNE

  • เลือก learning rate ให้เหมาะกับชุดข้อมูล
  • หากเลือกผิด: จุดข้อมูลจะกระจุกตัวรวมกัน
  • ลองค่าระหว่าง 50 ถึง 200
Unsupervised Learning ใน Python

ผลลัพธ์ที่ต่างกันในแต่ละครั้ง

  • ฟีเจอร์ของ t-SNE จะแตกต่างกันในแต่ละครั้ง
  • ไวน์ Piedmont รัน 3 ครั้ง ได้ scatter plot 3 แบบที่ต่างกัน!
  • ... อย่างไรก็ตาม: พันธุ์ไวน์ (=สี) มีตำแหน่งสัมพัทธ์ต่อกันเหมือนเดิม
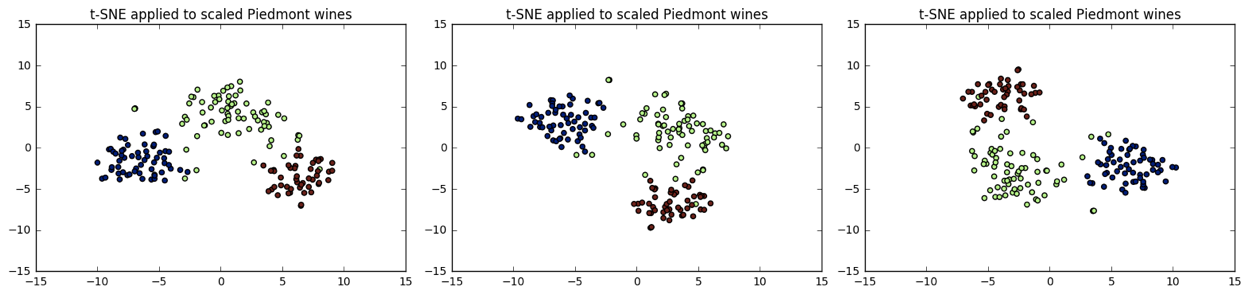
 

scatter plot 3 ภาพของ t-SNE ที่ใช้กับชุดข้อมูลไวน์ในการรัน 3 ครั้งที่ต่างกัน

Unsupervised Learning ใน Python

มาฝึกกันเถอะ!

Unsupervised Learning ใน Python

Preparing Video For Download...