Python เบื้องต้นสำหรับการเงิน
Adina Howe
Professor
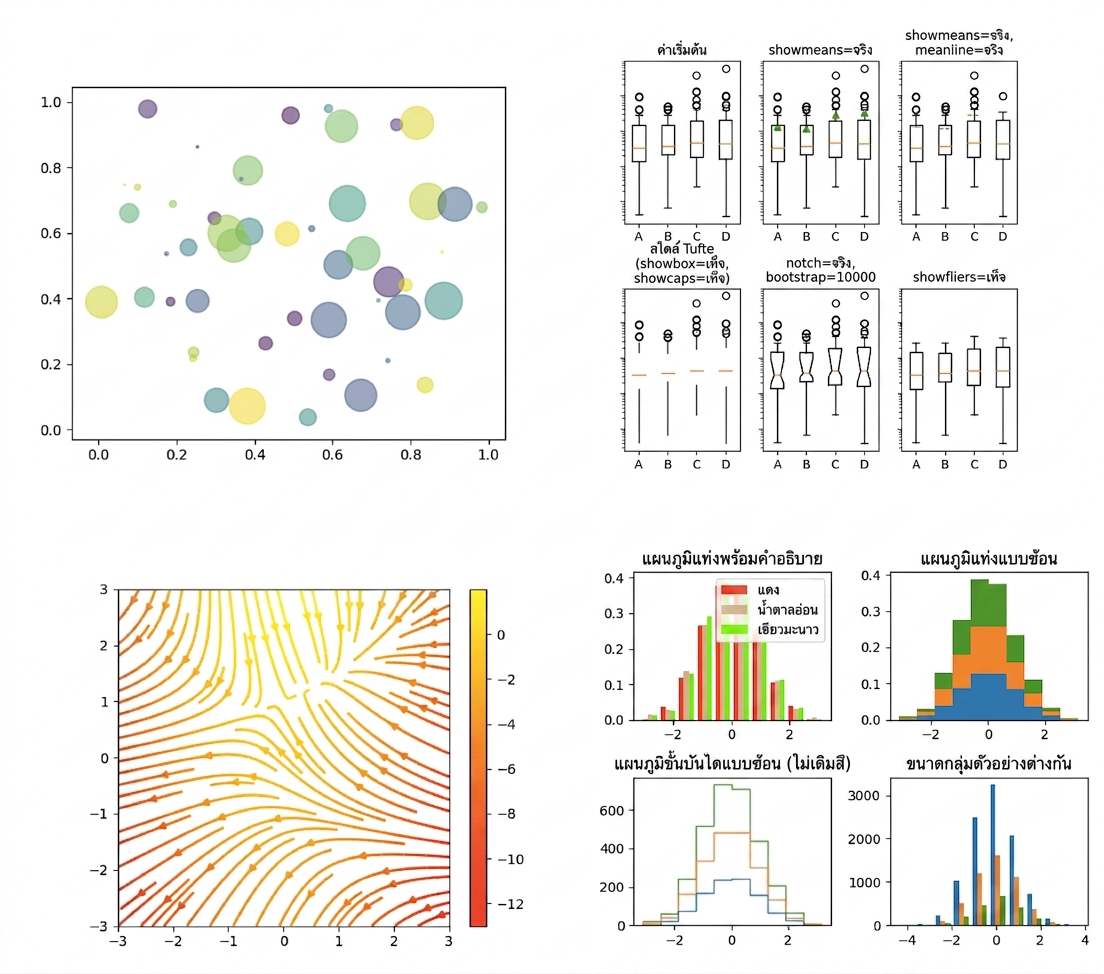
ดูตัวอย่างกราฟเพิ่มเติมจาก Matplotlib gallery ได้ที่ ลิงก์นี้
import matplotlib.pyplot as plt
plt.plot()
plt.show()
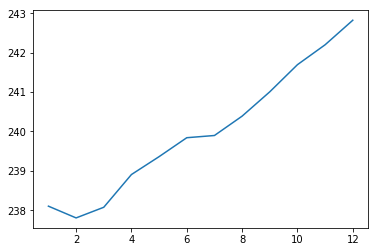
import matplotlib.pyplot as plt
plt.plot(months, prices)
plt.show()

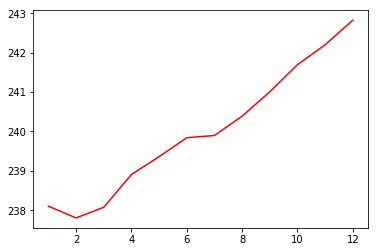
import matplotlib.pyplot as plt
plt.plot(months, prices, color = 'red')
plt.show()

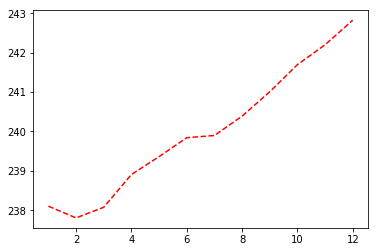
import matplotlib.pyplot as plt
plt.plot(months, prices, color = 'red', linestyle = '--')
plt.show()

| color | |
|---|---|
| 'green' | เขียว |
| 'red' | แดง |
| 'cyan' | ฟ้าอมเขียว |
| 'blue' | น้ำเงิน |
| linestyle | |
|---|---|
| '-' | เส้นทึบ |
| '--' | เส้นประ |
| '-.' | เส้นประจุด |
| ':' | จุด |
ดูเอกสารเพิ่มเติมเกี่ยวกับสีและรูปแบบเส้นได้ ที่นี่
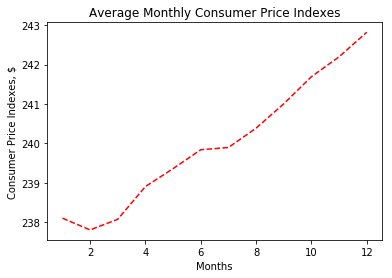
import matplotlib.pyplot as plt
plt.plot(months, prices, color = 'red', linestyle = '--')
# Add labels
plt.xlabel('Months')
plt.ylabel('Consumer Price Indexes, $')
plt.title('Average Monthly Consumer Price Indexes')
# Show plot
plt.show()

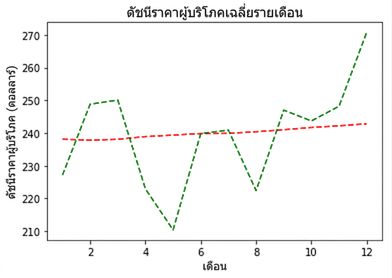
import matplotlib.pyplot as plt
plt.plot(months, prices, color = 'red', linestyle = '--')
# adding an additional line
plt.plot(months, prices_new, color = 'green', linestyle = '--')
plt.xlabel('Months')
plt.ylabel('Consumer Price Indexes, $')
plt.title('Average Monthly Consumer Price Indexes')
plt.show()

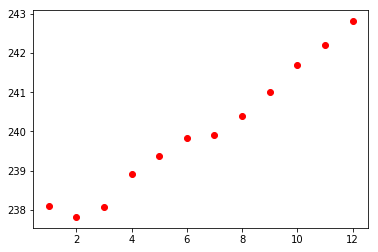
import matplotlib.pyplot as plt
plt.scatter(x = months, y = prices, color = 'red')
plt.show()

Python เบื้องต้นสำหรับการเงิน