DAX สำหรับการสร้างตารางและคอลัมน์

ฟังก์ชัน DAX ใน Power BI

Carl Rosseel

Curriculum Manager at DataCamp

DAX ย่อมาจาก Data Analysis Expressions

  • DAX คือภาษานิพจน์สูตรที่ใช้ในเครื่องมือ analytics ของ Microsoft หลายตัว

Screenshot 2021-06-08 at 10.15.24.png

  • สูตร DAX ประกอบด้วยฟังก์ชัน ตัวดำเนินการ และค่าเพื่อคำนวณขั้นสูง
  • สูตร DAX ใช้ใน:
    • Measures
    • Calculated columns
    • Calculated tables
    • Row-level security
ฟังก์ชัน DAX ใน Power BI

พลังของ DAX

  • เปิดความสามารถใหม่:
    • Joins, filters, measures และ calculated fields กลายเป็นส่วนหนึ่งของชุดเครื่องมือ
  • DAX + Power Query = เครื่องมือวิเคราะห์ข้อมูลที่ทรงพลัง:
    • เจาะลึกข้อมูลและดึง insight สำคัญออกมา
    • ใช้ DAX สำหรับการสร้างต้นแบบอย่างรวดเร็ว
ฟังก์ชัน DAX ใน Power BI

Measures vs calculated columns

Calculated Columns:

  • คำนวณเมื่อนำเข้าข้อมูล
  • มองเห็นได้ใน Table view และ Report view

COST = Orders[Sales] - Orders[Profit]

Order_ID Sales Profit Cost
3151 $77.88 $3.89 $73.99
3152 $6.63 $1.79 $4.84
3153 $22.72 $10.22 $12.50
3154 $45.36 $21.77 $23.59
ฟังก์ชัน DAX ใน Power BI

Measures vs calculated columns

Calculated Columns:

  • คำนวณเมื่อนำเข้าข้อมูล
  • มองเห็นได้ใน Table view และ Report view

COST = Orders[Sales] - Orders[Profit]

Order_ID Sales Profit Cost
3151 $77.88 $3.89 $73.99
3152 $6.63 $1.79 $4.84
3153 $22.72 $10.22 $12.50
3154 $45.36 $21.77 $23.59

Measures:

  • คำนวณเมื่อรันคิวรี
  • มองเห็นได้เฉพาะใน report pane

Total Sales = SUM(Orders[Sales])

Region Total Sales
Central $501,239.89
East $678,781.24
West $391,721.91
South $725.457.82
Total $2,297,200.86
ฟังก์ชัน DAX ใน Power BI

Context ช่วยให้วิเคราะห์ข้อมูลแบบไดนามิกได้

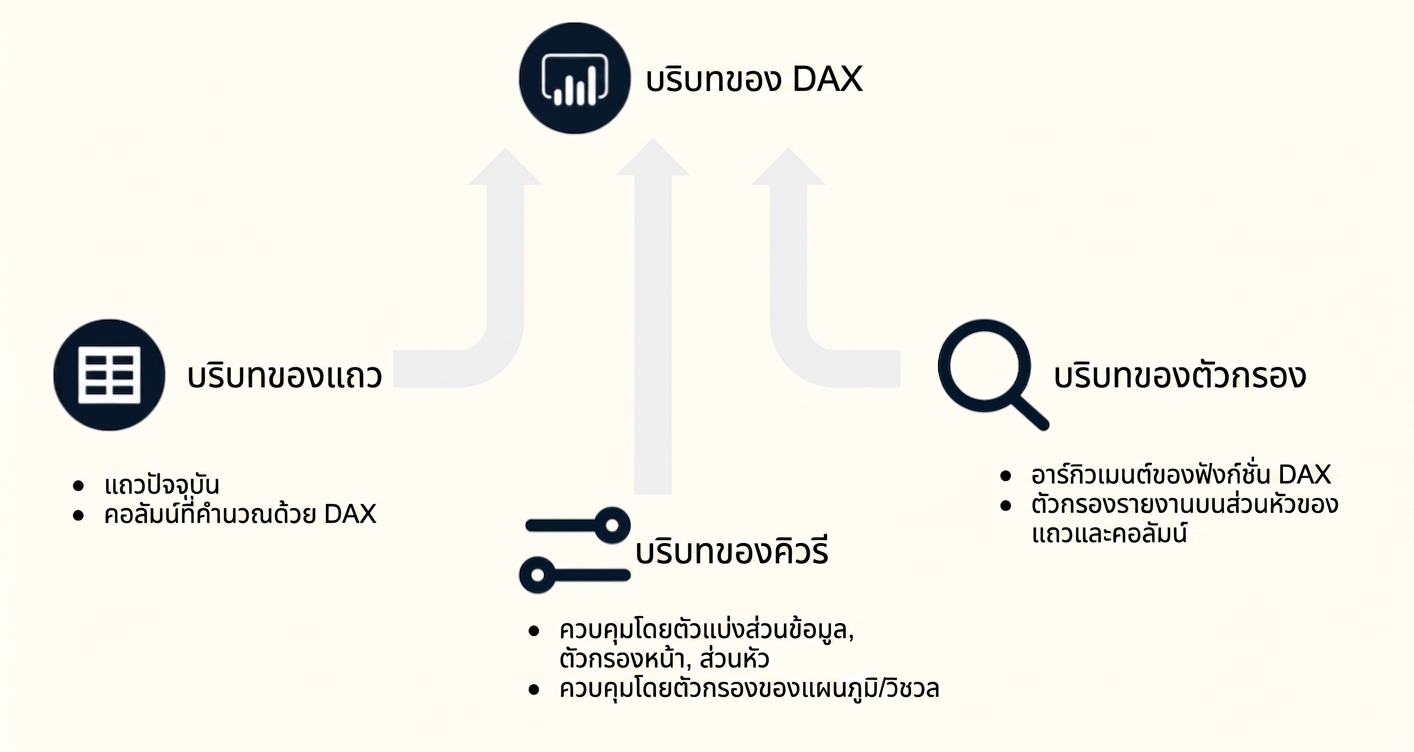
Context มี 3 ประเภท ได้แก่ row, query และ filter context

  • Row context: (1)
    • "แถวปัจจุบัน"
    • DAX calculated columns

COST = Orders[Sales] - Orders[Profit]

ฟังก์ชัน DAX ใน Power BI

Context ช่วยให้วิเคราะห์ข้อมูลแบบไดนามิกได้

Context มี 3 ประเภท ได้แก่ row, query และ filter context

  • Row context: (1)
    • "แถวปัจจุบัน"
    • DAX calculated columns

COST = Orders[Sales] - Orders[Profit]

Order_ID Sales Pofit Cost
3151 $77.88 $3.89 $73.99
3152 $6.63 $1.79 $4.84
3153 $22.72 $10.22 $12.50
3154 45.36 $21.77 $23.59
ฟังก์ชัน DAX ใน Power BI

Context ช่วยให้วิเคราะห์ข้อมูลแบบไดนามิกได้

Context มี 3 ประเภท ได้แก่ row, query และ filter context

  • Query context: (2)
    • หมายถึงชุดย่อยของข้อมูลที่ถูกดึงมาโดยปริยายสำหรับสูตร
    • ควบคุมโดย slicers, page filters, คอลัมน์ตาราง และ row headers
    • ควบคุมโดย chart/visual filters
    • ใช้งานหลัง row context
ฟังก์ชัน DAX ใน Power BI

Context ช่วยให้วิเคราะห์ข้อมูลแบบไดนามิกได้

  • Query context: (2)
    • ตัวอย่าง: กรองข้อมูลตาม Region
Region Total Sales
Central $501,239
East $678,781
West $391,721
South $725.457
  • Query context: (2)
    • ตัวอย่าง: กรองข้อมูลตาม State
State Total Sales
Alabama $13,724
Arizona $38,710
Arkansas $7,669
California $381,306
ฟังก์ชัน DAX ใน Power BI

Context ช่วยให้วิเคราะห์ข้อมูลแบบไดนามิกได้

Context มี 3 ประเภท ได้แก่ row, query และ filter context

  • Filter Context: (3)
    • ชุดค่าที่อนุญาตในแต่ละคอลัมน์ หรือค่าที่ดึงมาจากตารางที่เชื่อมกัน
    • กำหนดผ่าน argument ของสูตร หรือ report filters บน row และ column headings
    • ใช้งานหลัง query context
ฟังก์ชัน DAX ใน Power BI

Context ช่วยให้วิเคราะห์ข้อมูลแบบไดนามิกได้

Context มี 3 ประเภท ได้แก่ row, query และ filter context

  • Filter Context (3)

Total Costs East = CALCULATE([Total Costs], Orders[Region] = 'East')

Region Total costs Total costs East
Central $617,039
East $587,258 $587,258
West $461,534
South $344,972
Total $2,010,804 $587,258
ฟังก์ชัน DAX ใน Power BI

Context โดยสรุป

ภาพรวม Context.png

ฟังก์ชัน DAX ใน Power BI

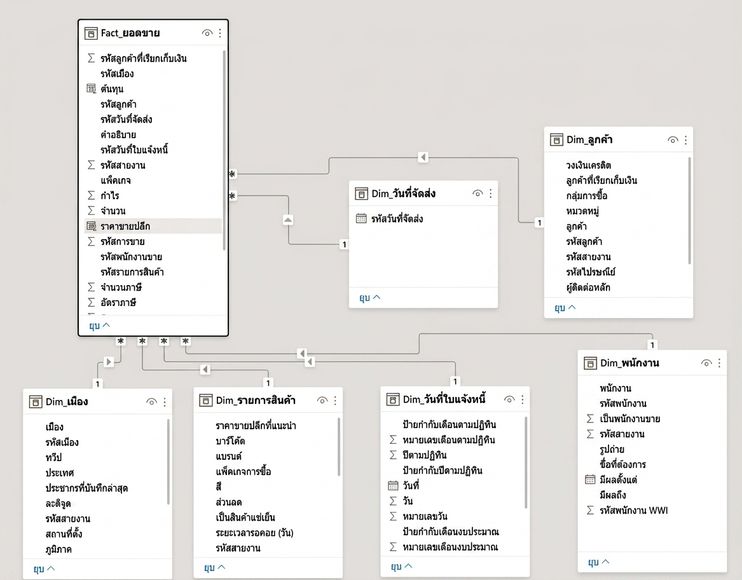
ชุดข้อมูล World Wide Importers

  • ผู้นำเข้าและจัดจำหน่ายสินค้าของขวัญสมมติ
  • ชุดข้อมูลประกอบด้วย:
    • fact table ที่บันทึกรายการขาย
    • dimension tables อื่น ๆ อีกหลายตาราง:
      • Dates
      • Customers
      • Cities
      • Employees
      • Stock Items

มุมมองโมเดล World Wide Importers.png

ฟังก์ชัน DAX ใน Power BI

มาฝึกกันเถอะ!

ฟังก์ชัน DAX ใน Power BI

Preparing Video For Download...