ต่อจาก infer pipeline

Hypothesis Testing in R

Richie Cotton

Data Evangelist at DataCamp

ทบทวน: สมมติฐานและชุดข้อมูล

$H_{0}$: สัดส่วนของผู้ที่ทำงานอดิเรกที่อายุต่ำกว่า 30 เท่ากับสัดส่วนของผู้ที่ทำงานอดิเรกที่อายุ 30 ปีขึ้นไป

$H_{A}$: สัดส่วนของผู้ที่ทำงานอดิเรกที่อายุต่ำกว่า 30 แตกต่างจากสัดส่วนของผู้ที่ทำงานอดิเรกที่อายุ 30 ปีขึ้นไป

alpha <- 0.1

stack_overflow_imbalanced %>% 
  count(hobbyist, age_cat, .drop = FALSE)
  hobbyist     age_cat    n
1       No At least 30    0
2       No    Under 30  191
3      Yes At least 30   15
4      Yes    Under 30 1025
Hypothesis Testing in R

ทบทวน: ขั้นตอนการทำงาน

null_distn <- dataset %>% 
  specify() %>% 
  hypothesize() %>% 
  generate() %>% 
  calculate()
observed_stat <- dataset %>% 
  specify() %>% 
  calculate()
get_p_value(null_distn, observed_stat)
stack_overflow_imbalanced %>%
  specify(hobbyist ~ age_cat, success = "Yes") %>% 
  hypothesize(null = "independence")
Response: hobbyist (factor)
Explanatory: age_cat (factor)
Null Hypothesis: independence
# A tibble: 1,231 x 2
  hobbyist age_cat    
  <fct>    <fct>      
1 Yes      At least 30
2 Yes      At least 30
3 Yes      At least 30
4 Yes      Under 30   
5 Yes      At least 30
6 Yes      At least 30
7 No       Under 30   
# ... with 1,224 more rows
Hypothesis Testing in R

แรงจูงใจในการใช้ generate()

$H_{0}$: สัดส่วนของผู้ที่ทำงานอดิเรกที่อายุต่ำกว่า 30 เท่ากับสัดส่วนของผู้ที่ทำงานอดิเรกที่อายุ 30 ปีขึ้นไป

หาก $H_{0}$ เป็นจริง

  • ในแต่ละแถว ค่า hobbyist อาจปรากฏร่วมกับหมวดอายุใดก็ได้โดยมีความน่าจะเป็นเท่ากัน
  • เพื่อจำลองสถานการณ์นี้ สามารถสุ่มสลับ (permute) ค่า hobbyist โดยคงหมวดอายุไว้เหมือนเดิม
Hypothesis Testing in R
stack_overflow_imbalanced


# A tibble: 1,231 x 2
  hobbyist age_cat    
  <fct>    <fct>      
1 Yes      At least 30
2 Yes      At least 30
3 Yes      At least 30
4 Yes      Under 30   
5 Yes      At least 30
6 Yes      At least 30
7 No       Under 30   
# ... with 1,224 more rows
bind_cols(
  stack_overflow_imbalanced %>% 
    select(hobbyist) %>% 
    slice_sample(prop = 1),
  stack_overflow_imbalanced %>% 
    select(age_cat)
)
# A tibble: 1,231 x 2
  hobbyist age_cat    
  <fct>    <fct>      
1 Yes      At least 30
2 Yes      At least 30
3 No       At least 30
4 No       Under 30   
5 Yes      At least 30
6 Yes      At least 30
7 Yes      Under 30   
# ... with 1,224 more rows
Hypothesis Testing in R

การสร้าง replicate จำนวนมาก

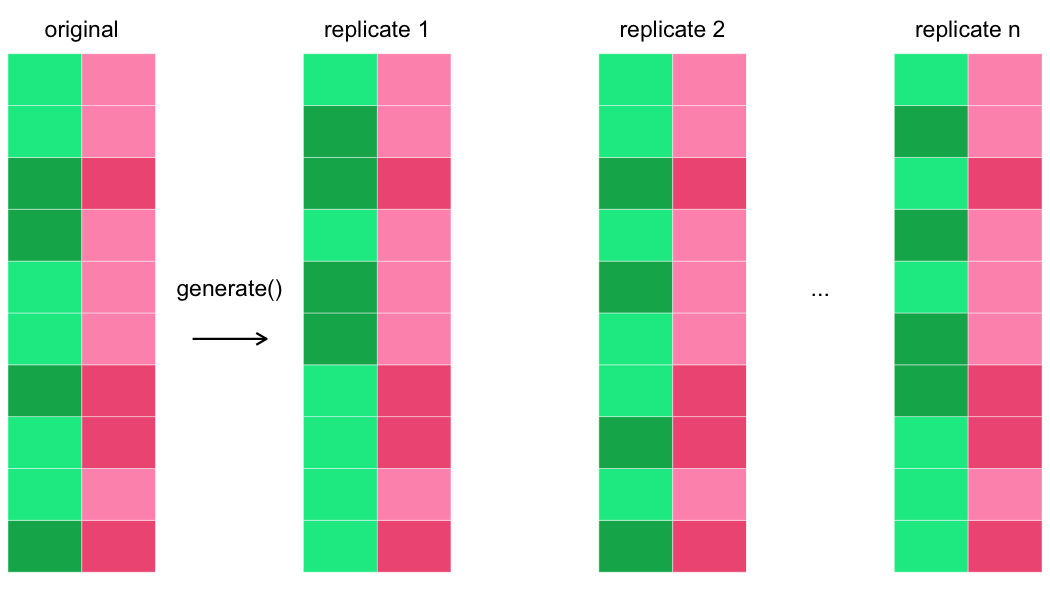
กริดสี่เหลี่ยมสองคอลัมน์ที่เป็นผลลัพธ์จากขั้นตอน specify แสดงอยู่ทางซ้าย ถัดมาทางขวาคือคำว่า generate พร้อมลูกศรชี้ขวา ทางขวาของลูกศรมีกริดสองคอลัมน์อีกสามชุดแทน replicate คอลัมน์ขวาของแต่ละ replicate เหมือนกับคอลัมน์ขวาของชุดข้อมูลต้นฉบับ แสดงว่าตัวแปรอธิบายไม่เปลี่ยนแปลง ส่วนคอลัมน์ซ้ายของแต่ละ replicate แตกต่างกัน แสดงว่าตัวแปรตอบสนองถูก permute แล้ว

Hypothesis Testing in R

generate()

generate() สร้างข้อมูลจำลองที่สะท้อน null hypothesis

  • สำหรับ null hypothesis แบบ "independence" ให้ตั้งค่า type เป็น "permute"
  • สำหรับ null hypothesis แบบ "point" ให้ตั้งค่า type เป็น "bootstrap" หรือ "simulate"
stack_overflow_imbalanced %>%
  specify(hobbyist ~ age_cat, success = "Yes") %>% 
  hypothesize(null = "independence") %>% 
  generate(reps = 5000, type = "permute")
Response: hobbyist (factor)
Explanatory: age_cat (factor)
Null Hypothesis: independence
# A tibble: 6,155,000 x 3
# Groups:   replicate [5,000]
  hobbyist age_cat     replicate
  <fct>    <fct>           <int>
1 Yes      At least 30         1
2 Yes      At least 30         1
3 Yes      At least 30         1
4 Yes      Under 30            1
5 Yes      At least 30         1
6 Yes      At least 30         1
7 Yes      Under 30            1
# ... with 6,154,993 more rows
Hypothesis Testing in R

การคำนวณค่าสถิติทดสอบ

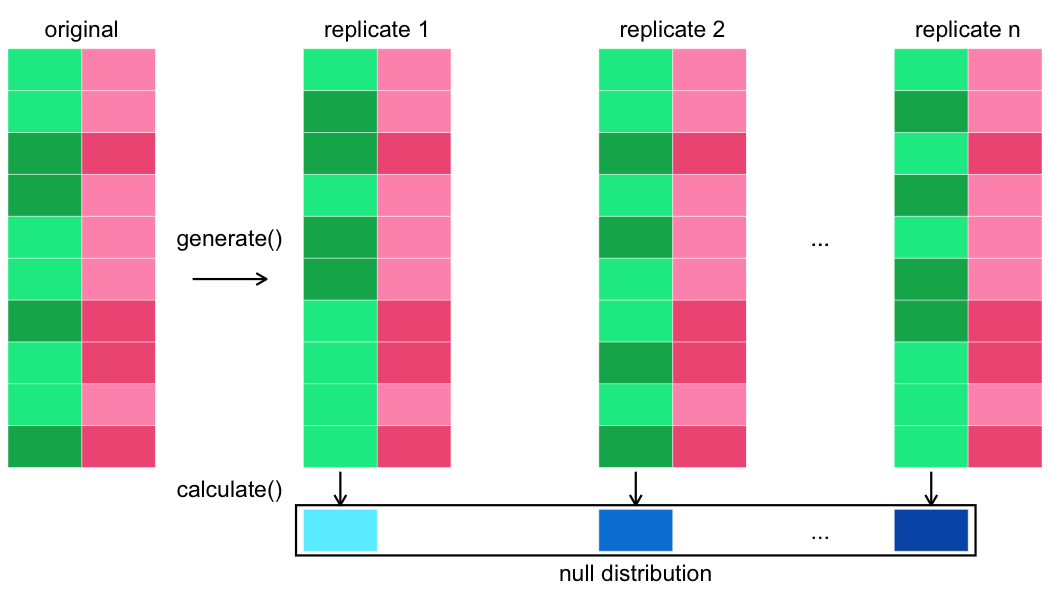
กริดสี่เหลี่ยมแทนชุดข้อมูลต้นฉบับและ replicate จากขั้นตอน generate แสดงอยู่ ด้านล่างมีคำว่า calculate พร้อมลูกศรชี้ลงใต้แต่ละ replicate ใต้ลูกศรแต่ละอันมีเซลล์แรเงาแทนค่าสถิติทดสอบ กล่องล้อมรอบค่าสถิติทดสอบทั้งหมดของ replicate และมีป้ายกำกับว่า null distribution

Hypothesis Testing in R

calculate()

calculate() คำนวณการแจกแจงของค่าสถิติทดสอบที่เรียกว่า null distribution

null_distn <- stack_overflow_imbalanced %>%
  specify(
    hobbyist ~ age_cat, 
    success = "Yes"
  ) %>%
  hypothesize(null = "independence") %>%
  generate(reps = 5000, type = "permute") %>%
  calculate(
    stat = "diff in props", 
    order = c("At least 30", "Under 30")
  )
# A tibble: 5,000 x 2
  replicate    stat
      <int>   <dbl>
1         1  0.0896
2         2  0.0896
3         3 -0.180 
4         4  0.157 
5         5  0.0896
6         6 -0.113 
7         7  0.0221
# ... with 4,993 more rows
1 หน้า help ของ ?calculate แสดงรายการค่าสถิติทดสอบที่รองรับทั้งหมด
Hypothesis Testing in R

การแสดงภาพ null distribution

visualize(null_distn)
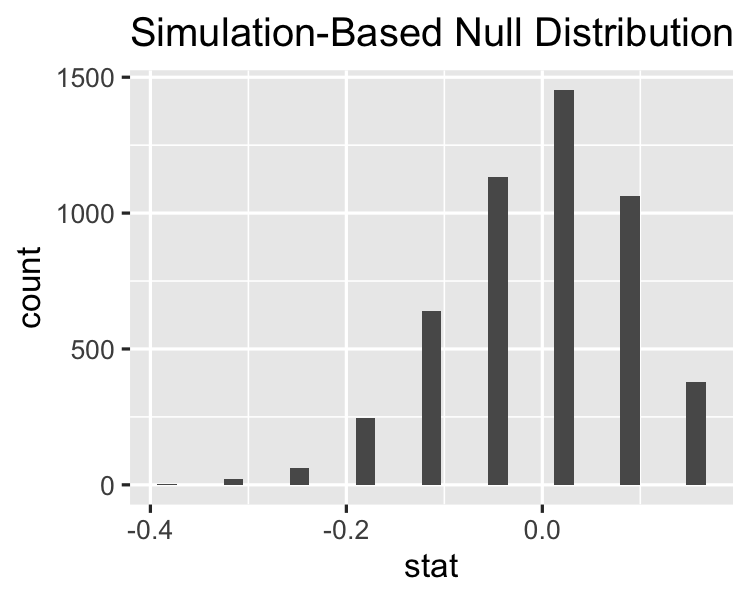
ฮิสโตแกรมของ null distribution มีความเบ้ซ้าย และมีค่าที่แตกต่างกันทั้งหมด 9 ค่า

null_distn %>% count(stat)
# A tibble: 9 x 2
     stat     n
    <dbl> <int>
1 -0.383      2
2 -0.315     22
3 -0.248     63
4 -0.180    246
5 -0.113    641
6 -0.0454  1132
7  0.0221  1453
8  0.0896  1063
9  0.157    378
Hypothesis Testing in R

การคำนวณค่าสถิติทดสอบจากชุดข้อมูลต้นฉบับ
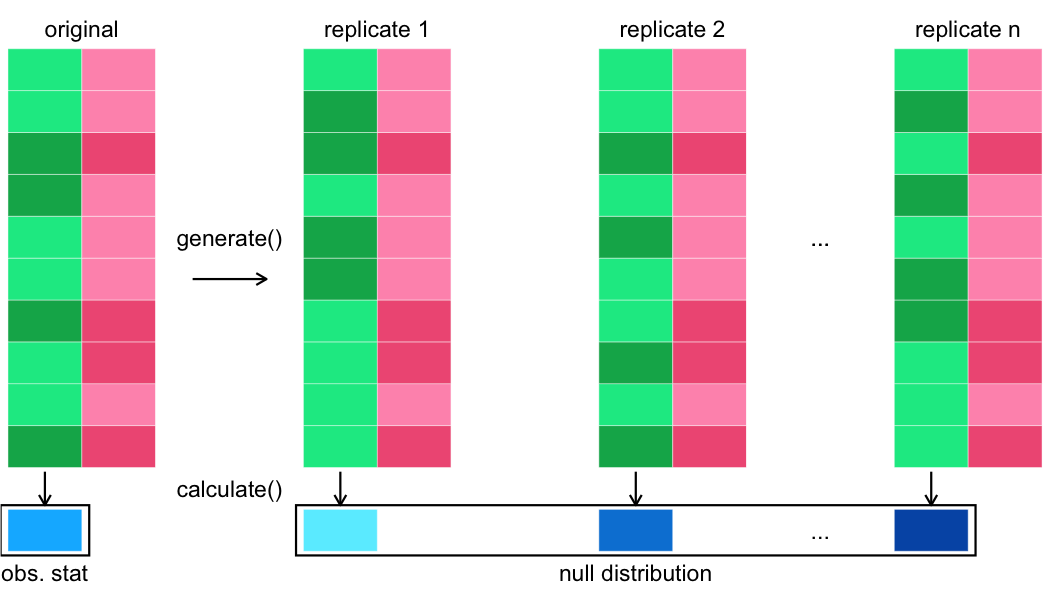
กริดสี่เหลี่ยมแทนชุดข้อมูลต้นฉบับและ replicate พร้อมเซลล์ null distribution จากขั้นตอน calculate แสดงอยู่ คราวนี้มีลูกศรชี้ลงใต้ชุดข้อมูลต้นฉบับด้วย และมีเซลล์แรเงาอยู่ด้านล่าง เซลล์นี้มีกล่องล้อมรอบและมีป้ายกำกับว่า observed statistic

Hypothesis Testing in R

ค่าสถิติที่สังเกตได้: specify() %>% calculate()

obs_stat <- stack_overflow_imbalanced %>%
  specify(hobbyist ~ age_cat, success = "Yes") %>%
  # hypothesize(null = "independence") %>%
  # generate(reps = 5000, type = "permute") %>%
  calculate(
    stat = "diff in props",
    order = c("At least 30", "Under 30")
  )
# A tibble: 1 x 1
   stat
  <dbl>
1 0.157
Hypothesis Testing in R

การแสดงภาพ null distribution เทียบกับค่าสถิติที่สังเกตได้
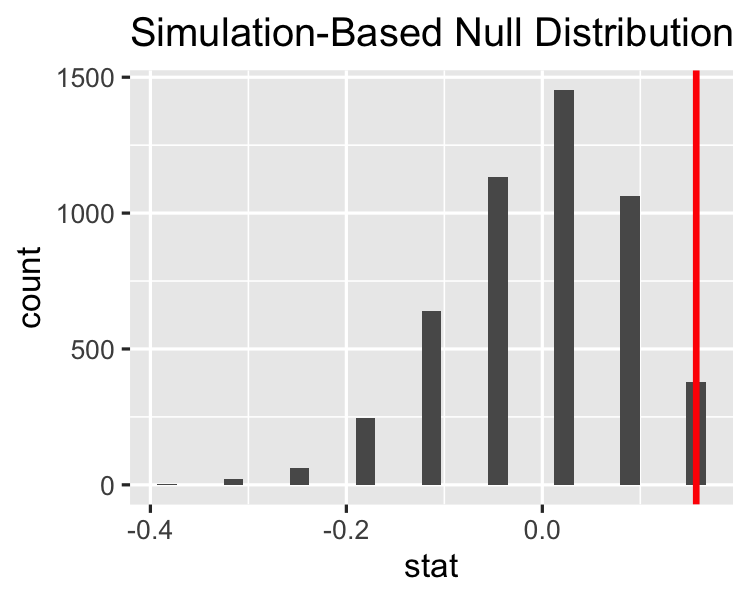
visualize(null_distn) +
  geom_vline(
    aes(xintercept = stat),
    data = observed_stat, 
    color = "red"
  )

ฮิสโตแกรมของ null distribution พร้อมเส้นแนวตั้งสีแดงที่ตำแหน่งค่าสถิติที่สังเกตได้ เส้นแนวตั้งอยู่เหนือแท่งขวาสุดของฮิสโตแกรม

Hypothesis Testing in R

หาค่า p-value

get_p_value(
  null_distn, obs_stat, 
  direction = "two sided"   # Not alternative = "two.sided"
)
# A tibble: 1 x 1
  p_value
    <dbl>
1   0.151
# A tibble: 1 x 6
  statistic chisq_df p_value alternative lower_ci upper_ci
      <dbl>    <dbl>   <dbl> <chr>          <dbl>    <dbl>
1      2.79        1  0.0949 two.sided    0.00718   0.0217
Hypothesis Testing in R

มาฝึกกันเถอะ!

Hypothesis Testing in R

Preparing Video For Download...