Chi-square test of independence

Hypothesis Testing in R

Richie Cotton

Data Evangelist at DataCamp

ทบทวน proportion test

library(infer)
stack_overflow %>% 
  prop_test(
    hobbyist ~ age_cat,
    order = c("At least 30", "Under 30"),
    alternative = "two-sided",
    correct = FALSE
  )
# A tibble: 1 x 6
  statistic chisq_df   p_value alternative lower_ci upper_ci
      <dbl>    <dbl>     <dbl> <chr>          <dbl>    <dbl>
1      17.8        1 0.0000248 two.sided     0.0605    0.165
Hypothesis Testing in R

ความเป็นอิสระของตัวแปร

ผลการทดสอบสมมติฐานก่อนหน้า: มีหลักฐานว่าตัวแปร hobbyist และ age_cat มีความสัมพันธ์กัน

หากสัดส่วนของความสำเร็จในตัวแปรตอบสนองเท่ากันในทุกหมวดหมู่ของตัวแปรอธิบาย แสดงว่าตัวแปรทั้งสองมีความเป็นอิสระทางสถิติ

1 ตัวแปรตอบสนองและตัวแปรอธิบายถูกนิยามไว้ใน "Introduction to Regression in R" บทที่ 1
Hypothesis Testing in R

ความพึงพอใจในงานและหมวดหมู่อายุ

stack_overflow %>% 
  count(age_cat)
# A tibble: 2 x 2
  age_cat         n
  <chr>       <int>
1 At least 30  1050
2 Under 30     1211
stack_overflow %>% 
  count(job_sat)
# A tibble: 5 x 2
  job_sat                   n
  <fct>                 <int>
1 Very dissatisfied       159
2 Slightly dissatisfied   342
3 Neither                 201
4 Slightly satisfied      680
5 Very satisfied          879
Hypothesis Testing in R

ระบุสมมติฐาน

$H_{0}$: หมวดหมู่อายุมีความเป็นอิสระจากระดับความพึงพอใจในงาน

$H_{A}$: หมวดหมู่อายุไม่มีความเป็นอิสระจากระดับความพึงพอใจในงาน

alpha <- 0.1
  • สถิติทดสอบแทนด้วย $\chi^{2}$
  • ภายใต้สมมติฐานความเป็นอิสระ ผลที่สังเกตได้ห่างจากค่าที่คาดหวังมากเพียงใด
Hypothesis Testing in R

การแสดงผลเชิงสำรวจ: กราฟแท่งแบบซ้อนตามสัดส่วน

ggplot(stack_overflow, aes(job_sat, fill = age_cat)) +
  geom_bar(position = "fill") +
  ylab("proportion")
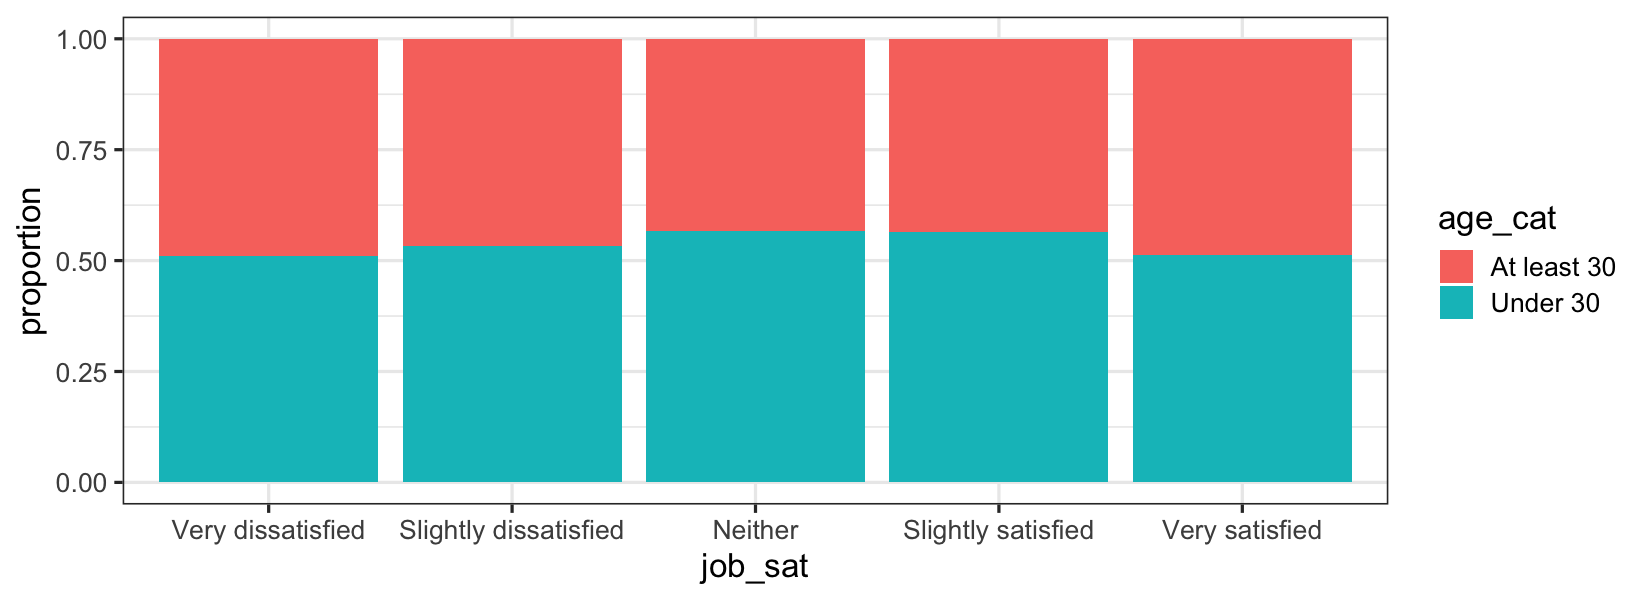
กราฟแท่งแบบซ้อนตามสัดส่วนของความพึงพอใจในงาน แบ่งตามหมวดหมู่อายุ

Hypothesis Testing in R

Chi-square independence test ด้วย chisq_test()

library(infer)
stack_overflow %>% 
  chisq_test(age_cat ~ job_sat)
# A tibble: 1 x 3
  statistic chisq_df p_value
      <dbl>    <int>   <dbl>
1      5.55        4   0.235

ดีกรีของความเป็นอิสระ:

$(\text{No. of response categories} - 1) \times (\text{No. of explanatory categories} - 1)$

$(2 - 1) * (5 - 1) = 4$

Hypothesis Testing in R

สลับตัวแปรได้ไหม?

ggplot(stack_overflow, aes(age_cat, fill = job_sat)) +
  geom_bar(position = "fill") +
  ylab("proportion")
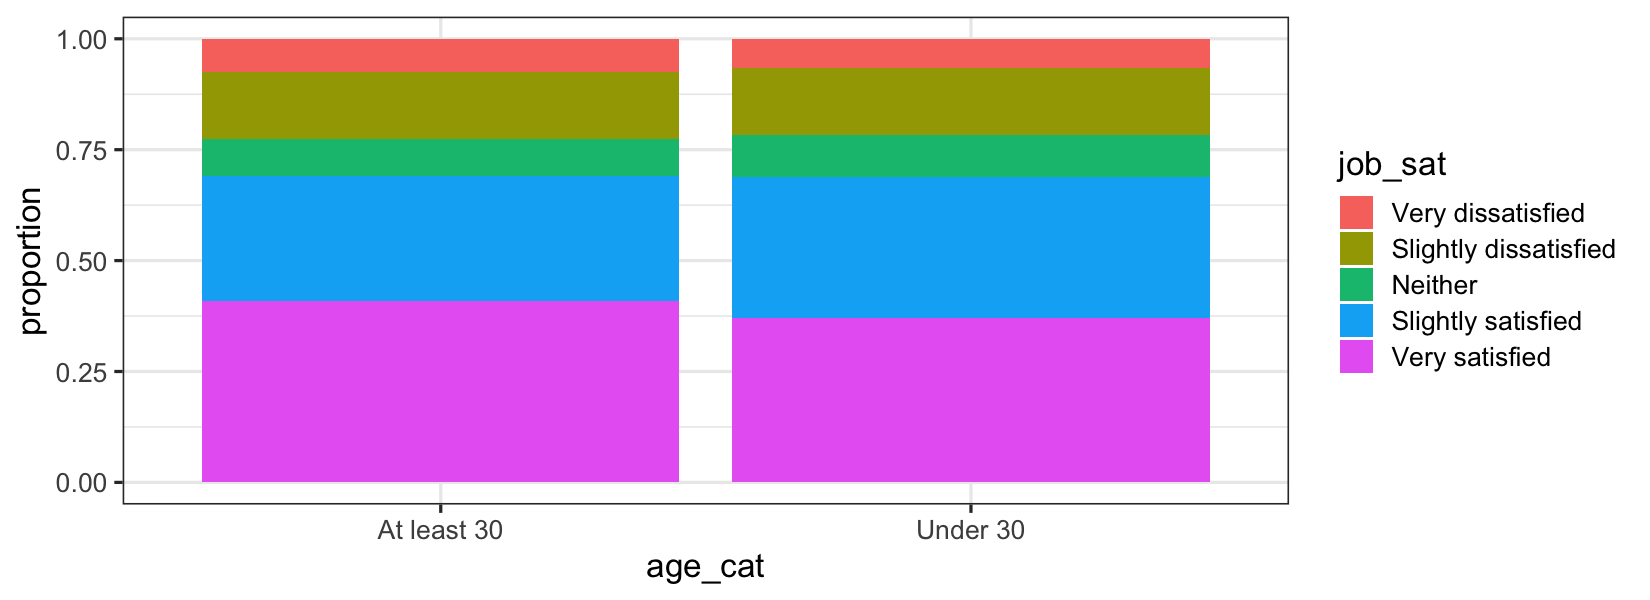
กราฟแท่งแบบซ้อนตามสัดส่วนของหมวดหมู่อายุ แบ่งตามความพึงพอใจในงาน

Hypothesis Testing in R

Chi-square ทั้งสองทิศทาง

library(infer)
stack_overflow %>% 
  chisq_test(age_cat ~ job_sat)
# A tibble: 1 x 3
  statistic chisq_df p_value
      <dbl>    <int>   <dbl>
1      5.55        4   0.235

ถามได้

ตัวแปร X และ Y มีความเป็นอิสระต่อกันไหม?

library(infer)
stack_overflow %>% 
  chisq_test(job_sat ~ age_cat)
# A tibble: 1 x 3
  statistic chisq_df p_value
      <dbl>    <int>   <dbl>
1      5.55        4   0.235

ไม่ควรถาม

ตัวแปร X มีความเป็นอิสระจากตัวแปร Y ไหม?

Hypothesis Testing in R

ทิศทางและหางของการทดสอบ?

args(chisq_test)
function (x, formula, response = NULL, explanatory = NULL, ...)
  • จำนวนที่สังเกตและคาดหวังยกกำลังสองต้องไม่ติดลบ
  • chi-square test มักเป็นการทดสอบแบบหางขวาเสมอ $^{1}$
1 Chi-square test แบบหางซ้ายใช้ในการพิสูจน์ทางสถิติเพื่อตรวจหาว่าข้อมูลถูกปรับแต่งจนความพอดีดีเกินจริง Chi-square test ของความแปรปรวนสามารถเป็นแบบสองหางได้ แต่กรณีเหล่านี้เป็นการใช้งานเฉพาะทาง
Hypothesis Testing in R

มาฝึกกันเถอะ!

Hypothesis Testing in R

Preparing Video For Download...