การทดสอบ Chi-square goodness of fit

Hypothesis Testing in R

Richie Cotton

Data Evangelist at DataCamp

ลิงก์สีม่วง

ค้นหาวิธีเขียนโค้ดออนไลน์แล้วพบว่าลิงก์แรกเป็นสีม่วง เพราะเคยเปิดไปแล้ว รู้สึกอย่างไร?

purple_link_counts <- stack_overflow %>% 
  count(purple_link)
# A tibble: 4 x 2
  purple_link           n
  <fct>             <int>
1 Hello, old friend  1330
2 Amused              409
3 Indifferent         426
4 Annoyed             290
Hypothesis Testing in R

การกำหนดสมมติฐาน

hypothesized <- tribble(
  ~ purple_link, ~ prop,
  "Hello, old friend", 1 / 2,
  "Amused"           , 1 / 6,
  "Indifferent"      , 1 / 6,
  "Annoyed"          , 1 / 6
)
# A tibble: 4 x 2
  purple_link        prop
  <chr>             <dbl>
1 Hello, old friend 0.5  
2 Amused            0.167
3 Indifferent       0.167
4 Annoyed           0.167

$H_{0}$: ตัวอย่างสอดคล้องกับการแจกแจงที่ตั้งสมมติฐานไว้

$H_{A}$: ตัวอย่างไม่สอดคล้องกับการแจกแจงที่ตั้งสมมติฐานไว้

ค่าสถิติทดสอบ $\chi^{2}$ วัดความแตกต่างระหว่างผลที่สังเกตได้กับค่าที่คาดหวังในแต่ละกลุ่ม

alpha <- 0.01
1 tribble ย่อมาจาก "row-wise tibble" ไม่ใช่สายพันธุ์มนุษย์ต่างดาวใน Star Trek
Hypothesis Testing in R

จำนวนที่คาดหวังตามสมมติฐานในแต่ละหมวดหมู่

n_total <- nrow(stack_overflow)
hypothesized <- tribble(
  ~ purple_link, ~ prop,
  "Hello, old friend", 1 / 2,
  "Amused"           , 1 / 6,
  "Indifferent"      , 1 / 6,
  "Annoyed"          , 1 / 6
) %>%
  mutate(n = prop * n_total)
# A tibble: 4 x 3
  purple_link        prop     n
  <chr>             <dbl> <dbl>
1 Hello, old friend 0.5   1228.
2 Amused            0.167  409.
3 Indifferent       0.167  409.
4 Annoyed           0.167  409.
Hypothesis Testing in R

แสดงผลจำนวนด้วยกราฟ

ggplot(purple_link_counts, aes(purple_link, n)) +
  geom_col() +
  geom_point(data = hypothesized, color = "purple")
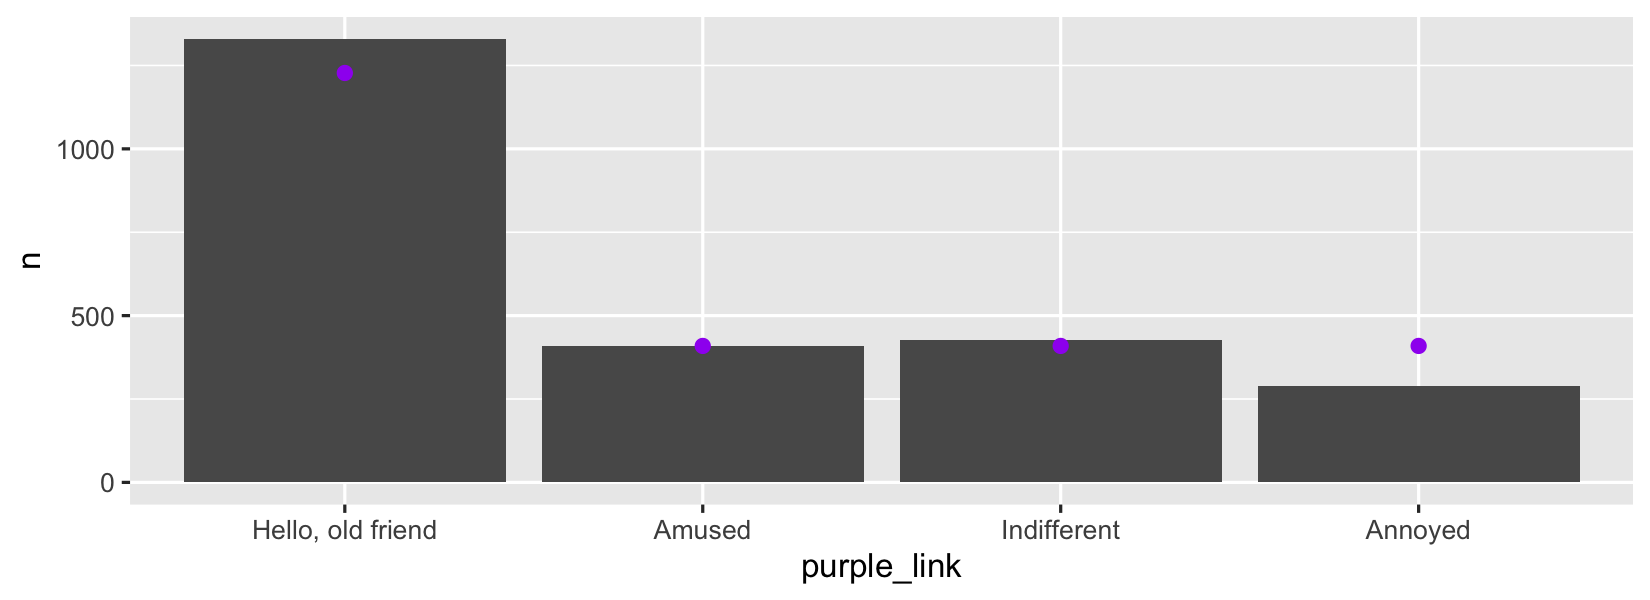
กราฟแท่งแสดงจำนวนคำตอบเทียบกับ purple_link พร้อมจุดสีม่วงแสดงจำนวนที่คาดหวังตามสมมติฐาน

Hypothesis Testing in R

การทดสอบ chi-square goodness of fit ด้วย `chisq_test()`

hypothesized_props <- c(
  "Hello, old friend" = 1 / 2,
  Amused              = 1 / 6,
  Indifferent         = 1 / 6,
  Annoyed             = 1 / 6
)
library(infer)
stack_overflow %>% 
  chisq_test(
    response = purple_link,
    p = hypothesized_props
  )
# A tibble: 1 x 3
  statistic chisq_df       p_value
      <dbl>    <dbl>         <dbl>
1      44.0        3 0.00000000154
Hypothesis Testing in R

มาฝึกกันเถอะ!

Hypothesis Testing in R

Preparing Video For Download...