กรอบแนวคิด "There is only one test"
Hypothesis Testing in R

Richie Cotton
Data Evangelist at DataCamp
ข้อมูลที่ไม่สมดุล
stack_overflow_imbalanced %>%
  count(hobbyist, age_cat, .drop = FALSE)
  hobbyist     age_cat    n
1       No At least 30    0
2       No    Under 30  191
3      Yes At least 30   15
4      Yes    Under 30 1025
ข้อมูลเรียกว่า imbalanced เมื่อบางกลุ่มมีขนาดใหญ่กว่ากลุ่มอื่นมาก
สมมติฐาน
$H_{0}$: สัดส่วนของ hobbyists ที่อายุต่ำกว่า 30 เท่ากับ สัดส่วนของ hobbyists ที่อายุ 30 ขึ้นไป
$H_{A}$: สัดส่วนของ hobbyists ที่อายุต่ำกว่า 30 แตกต่างจาก สัดส่วนของ hobbyists ที่อายุ 30 ขึ้นไป
alpha <- 0.1
ดำเนินการทดสอบสัดส่วนต่อไปโดยไม่คำนึงถึงความไม่สมดุล
stack_overflow_imbalanced %>%
  prop_test(
    hobbyist ~ age_cat,
    order = c("At least 30", "Under 30"),
    success = "Yes",
    alternative = "two.sided",
    correct = FALSE
  )
# A tibble: 1 x 6
  statistic chisq_df p_value alternative lower_ci upper_ci
      <dbl>    <dbl>   <dbl> <chr>          <dbl>    <dbl>
1      2.79        1  0.0949 two.sided    0.00718   0.0217
ไวยากรณ์ของกราฟิก
| ประเภทกราฟ | base-R | ggplot2 |
|---|---|---|
| Scatter plot | plot(, type = "p") |
ggplot() + geom_point() |
| Line plot | plot(, type = "l") |
ggplot() + geom_line() |
| Histogram | hist() |
ggplot() + geom_histogram() |
| Box plot | boxplot() |
ggplot() + geom_boxplot() |
| Bar plot | barplot() |
ggplot() + geom_bar() |
| Pie plot | pie() |
ggplot() + geom_bar() + coord_polar() |
ไวยากรณ์ของการทดสอบสมมติฐาน
- กรอบแนวคิด There is only one test ของ Allen Downey
- นำมาใช้งานใน R ผ่านแพ็กเกจ
infer generate()สร้างข้อมูลจำลอง- ใช้ทรัพยากรการคำนวณสูง
- ทนทานต่อตัวอย่างขนาดเล็กหรือข้อมูลที่ไม่สมดุล
null_distn <- dataset %>%
  specify() %>%
  hypothesize() %>%
  generate() %>%
  calculate()
obs_stat <- dataset %>%
  specify() %>%
  calculate()
get_p_value(null_distn, obs_stat)
1 Allen Downey สอนวิชา "Exploratory Data Analysis in Python"
การระบุตัวแปรที่สนใจ
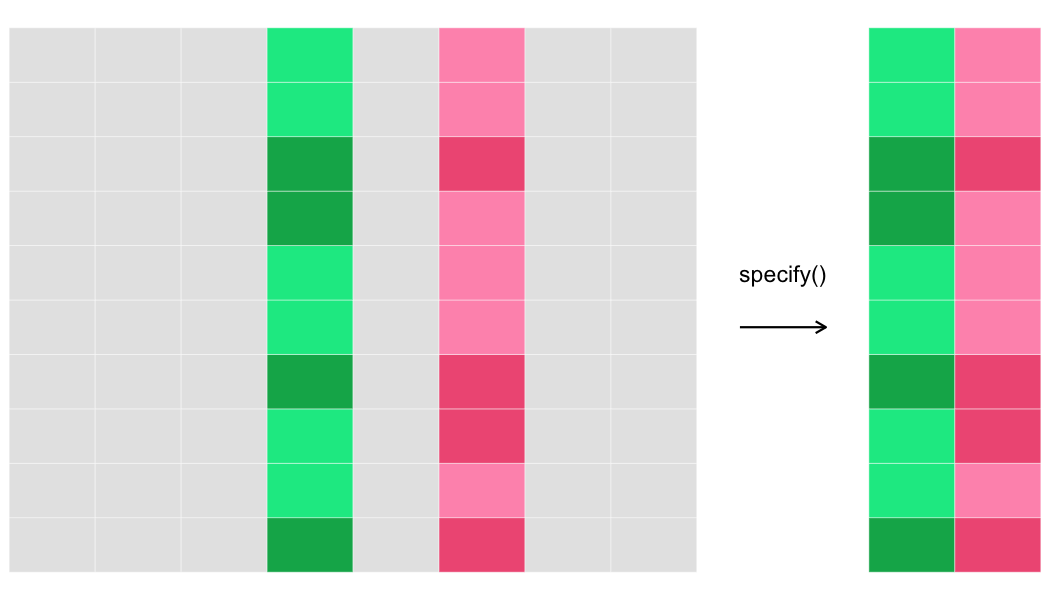
specify()
specify()เลือกตัวแปรที่ต้องการทดสอบ
- สำหรับการทดสอบ 2 กลุ่ม ใช้
response ~ explanatory - สำหรับการทดสอบ 1 กลุ่ม ใช้
response ~ NULL
stack_overflow_imbalanced %>%
  specify(hobbyist ~ age_cat, success = "Yes")
Response: hobbyist (factor)
Explanatory: age_cat (factor)
# A tibble: 1,231 x 2
  hobbyist age_cat
  <fct>    <fct>
1 Yes      At least 30
2 Yes      At least 30
3 Yes      At least 30
4 Yes      Under 30
5 Yes      At least 30
6 Yes      At least 30
7 No       Under 30
# ... with 1,224 more rows
hypothesize()
hypothesize()ระบุประเภทของสมมติฐานว่าง
- สำหรับการทดสอบ 2 กลุ่ม ใช้
"independence"หรือ"point" - สำหรับการทดสอบ 1 กลุ่ม ใช้
"point"
stack_overflow_imbalanced %>%
  specify(hobbyist ~ age_cat, success = "Yes") %>%
  hypothesize(null = "independence")
Response: hobbyist (factor)
Explanatory: age_cat (factor)
Null Hypothesis: independence
# A tibble: 1,231 x 2
  hobbyist age_cat
  <fct>    <fct>
1 Yes      At least 30
2 Yes      At least 30
3 Yes      At least 30
4 Yes      Under 30
5 Yes      At least 30
6 Yes      At least 30
7 No       Under 30
# ... with 1,224 more rows
มาฝึกกันเถอะ!
Hypothesis Testing in R

