Seaborn 柱状图

在 Python 中处理分类数据

Kasey Jones

Research Data Scientist

传统柱状图

# Code provided for clarity
reviews["Traveler type"].value_counts().plot.bar()
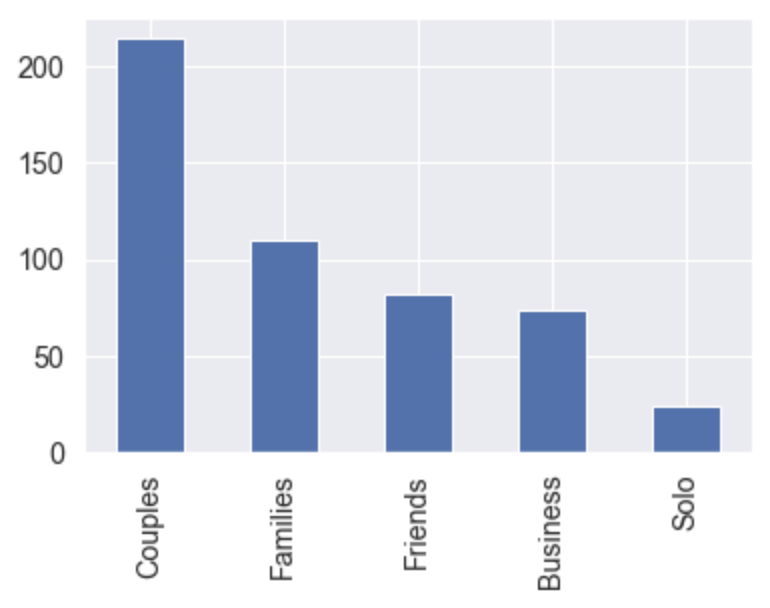
按不同出行者类型统计点评数量的柱状图。

在 Python 中处理分类数据

语法

sns.set(font_scale=1.3)
sns.set_style("darkgrid")

sns.catplot(x="Traveler type", y="Score", data=reviews, kind="bar")
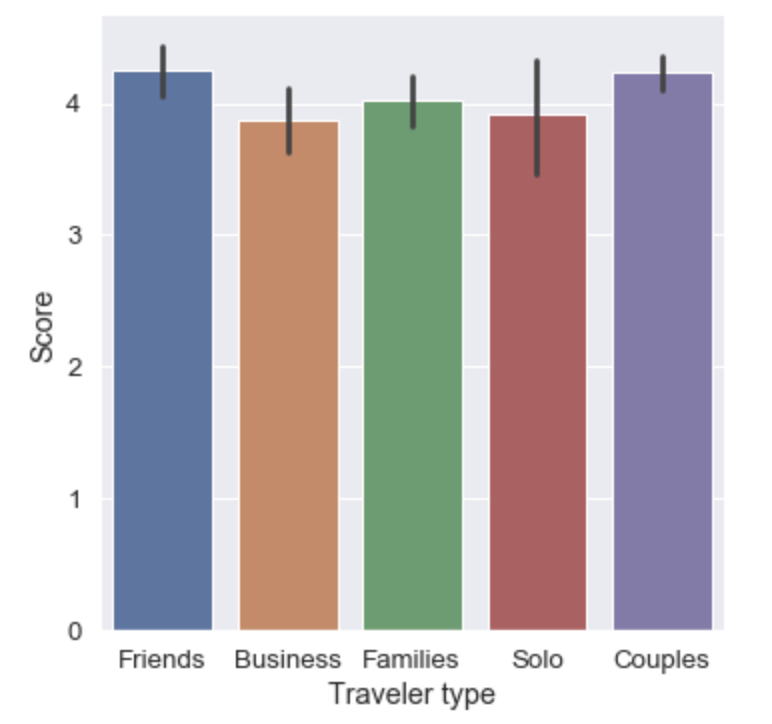
按出行者类型展示酒店点评分数的 seaborn 分类柱状图。

在 Python 中处理分类数据

设置类别顺序

reviews["Traveler type"] = reviews["Traveler type"].astype("category")
reviews["Traveler type"].cat.categories
Index(['Business', 'Couples', 'Families', 'Friends', 'Solo'], dtype='object')
在 Python 中处理分类数据

更新后的可视化

sns.catplot(x="Traveler type", y="Score", data=reviews, kind="bar")
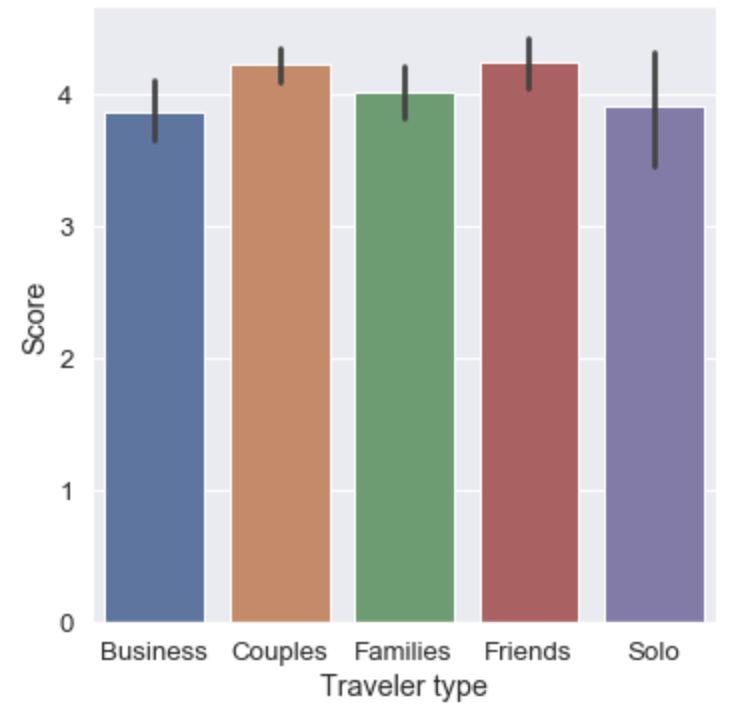
  • 注意:catplot() 有一个 order 参数
在 Python 中处理分类数据

hue 参数

  • hue
    • data 中的变量名
    • 用于按第二个类别拆分数据
    • 也用于着色
sns.set(font_scale=1.2)
sns.set_style("darkgrid")
sns.catplot(x="Traveler type", y="Score", data=reviews, kind="bar",
            hue="Tennis court")  # <--- new parameter
在 Python 中处理分类数据

两个变量的柱状图

在 Python 中处理分类数据

柱状图练习

在 Python 中处理分类数据

Preparing Video For Download...