点图与计数图

在 Python 中处理分类数据

Kasey Jones

Research Data Scientist

点图示例

sns.catplot(x="Pool", y="Score", data=reviews, kind="point") # <--- updated
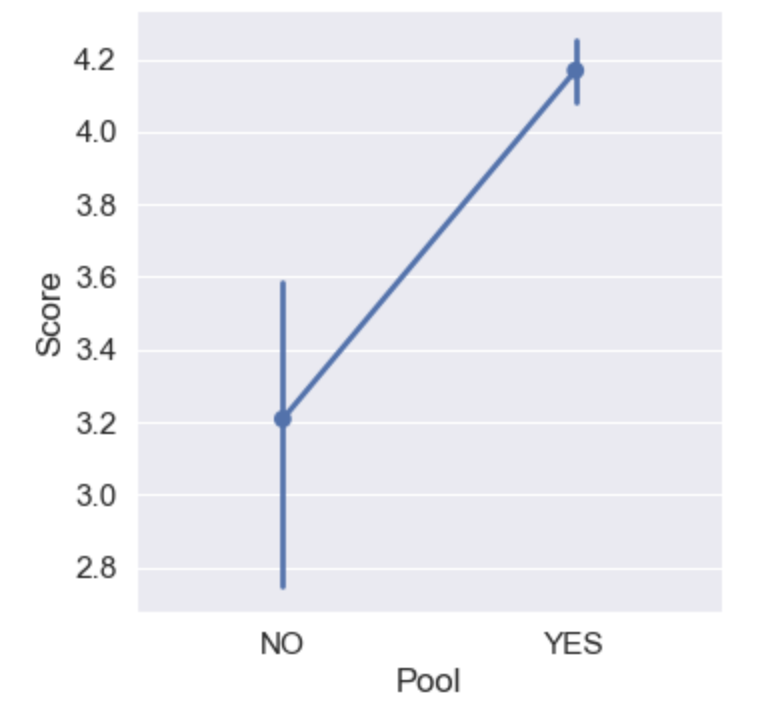
使用 seaborn 创建的点图,展示酒店是否有泳池对评论者评分均值的影响。

在 Python 中处理分类数据

柱状图 vs. 点图

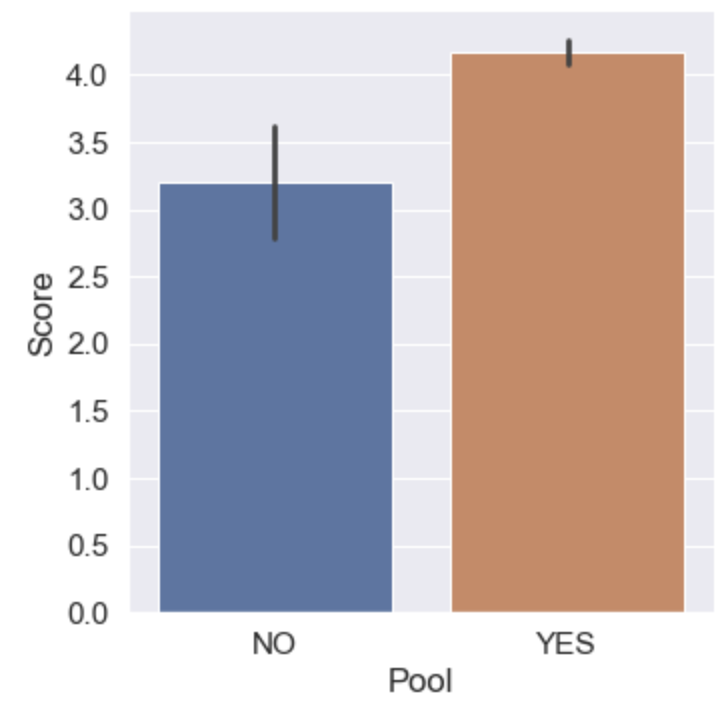
柱状图 使用 seaborn 创建的柱状图,展示酒店是否有泳池时评论者评分的集中趋势。

点图 使用 seaborn 创建的点图,展示酒店是否有泳池时评论者评分的集中趋势。

在 Python 中处理分类数据

带 hue 的点图

sns.catplot(x="Spa", y="Score", data=reviews, kind="point",
            hue="Tennis court", dodge=True  # < --- New Parameter!
)
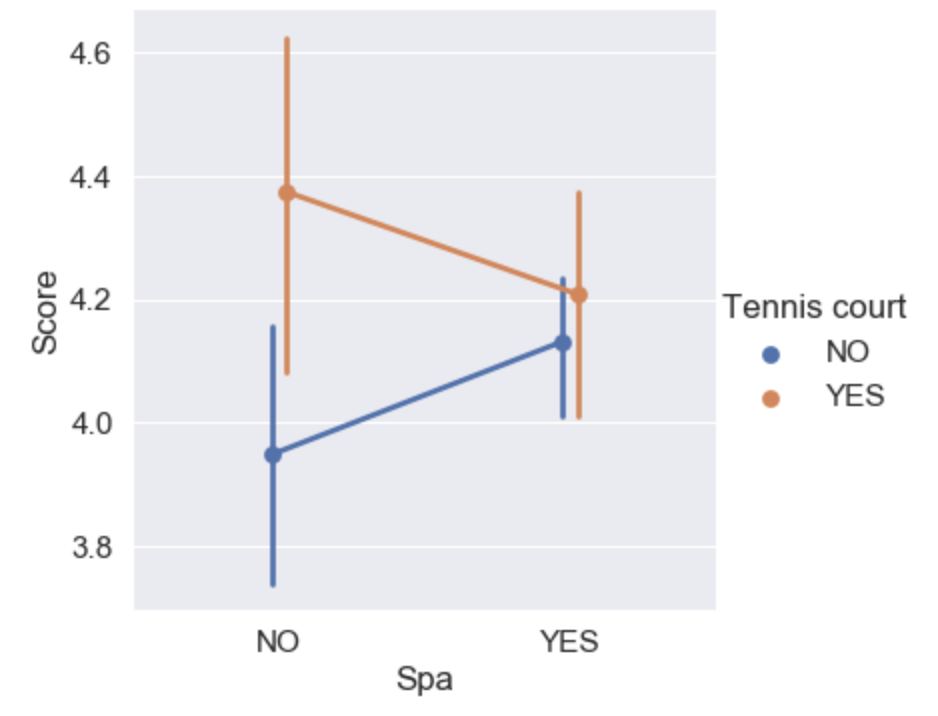
使用 seaborn 创建的点图,展示评分在 Spa 与 Tennis court 两个参数下的集中趋势。本图使用了 hue 与 dodge 参数。

在 Python 中处理分类数据

使用 join 参数

sns.catplot(x="Score",
            y="Review weekday",
            data=reviews,
            kind="point", 
            join=False # < --- New!
)

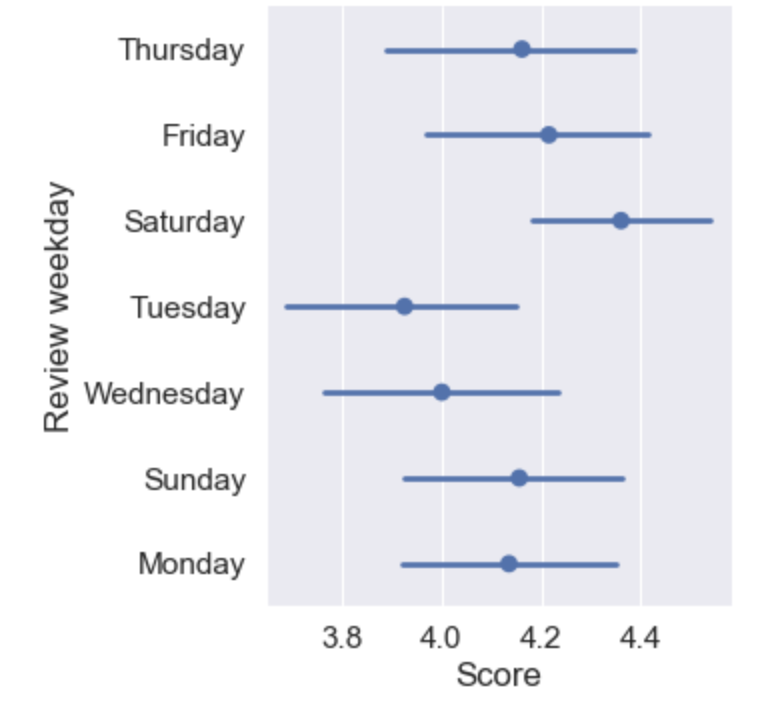
使用 seaborn 创建的点图,展示 join 参数对输出的影响。

在 Python 中处理分类数据

最后一种 catplot 类型

sns.catplot(x="Tennis court", data=reviews, kind="count", hue="Spa")
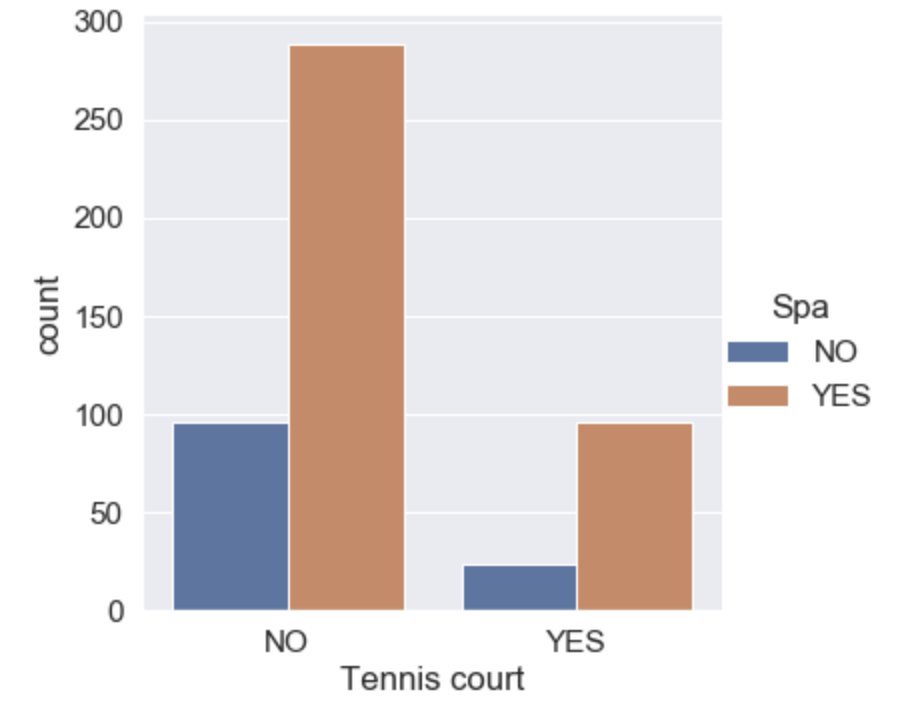
展示 seaborn 计数图的示例。该图统计带网球场、带水疗、两者都有或都没有的酒店评论次数。

在 Python 中处理分类数据

时间练习!

在 Python 中处理分类数据

Preparing Video For Download...