Python 中的 Plotly 数据可视化入门
Alex Scriven
Data Scientist
$$
add_trace()
from plotly.graph_objects import Figure

layered_fig = Figure()

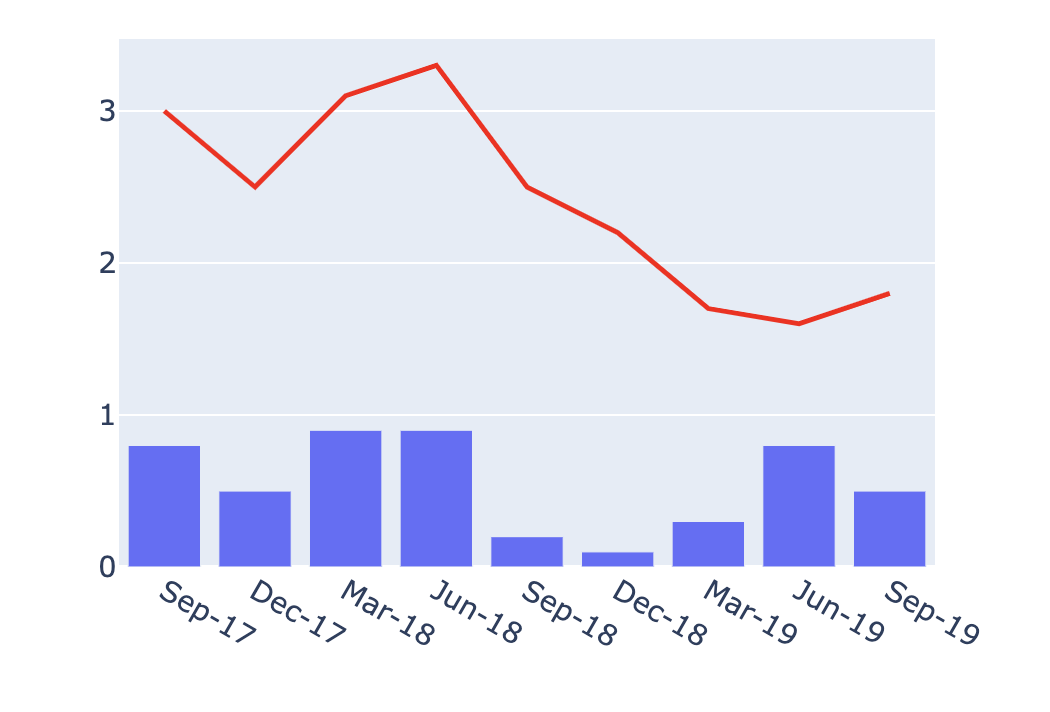
bar_fig = px.bar(df, x='Date'
      , y='Quarterly Growth (%)')

line_fig = px.line(df, x='Date'
      , y='Rolling YTD Growth (%)'
      , color_discrete_sequence=['red'])

layered_fig = Figure(data=
   [*bar_fig.data, *line_fig.data])
layered_fig.show()
from plotly.graph_objects import Figure layered_fig = Figure()
bar_fig = px.bar(df, x='Date' , y='Quarterly Growth (%)')
line_fig = px.line(df, x='Date' , y='Rolling YTD Growth (%)' , color_discrete_sequence=['red'])
layered_fig = Figure(data= [*bar_fig.data, *line_fig.data]) layered_fig.show()
# 生成相同的 bar_fig、line_fig
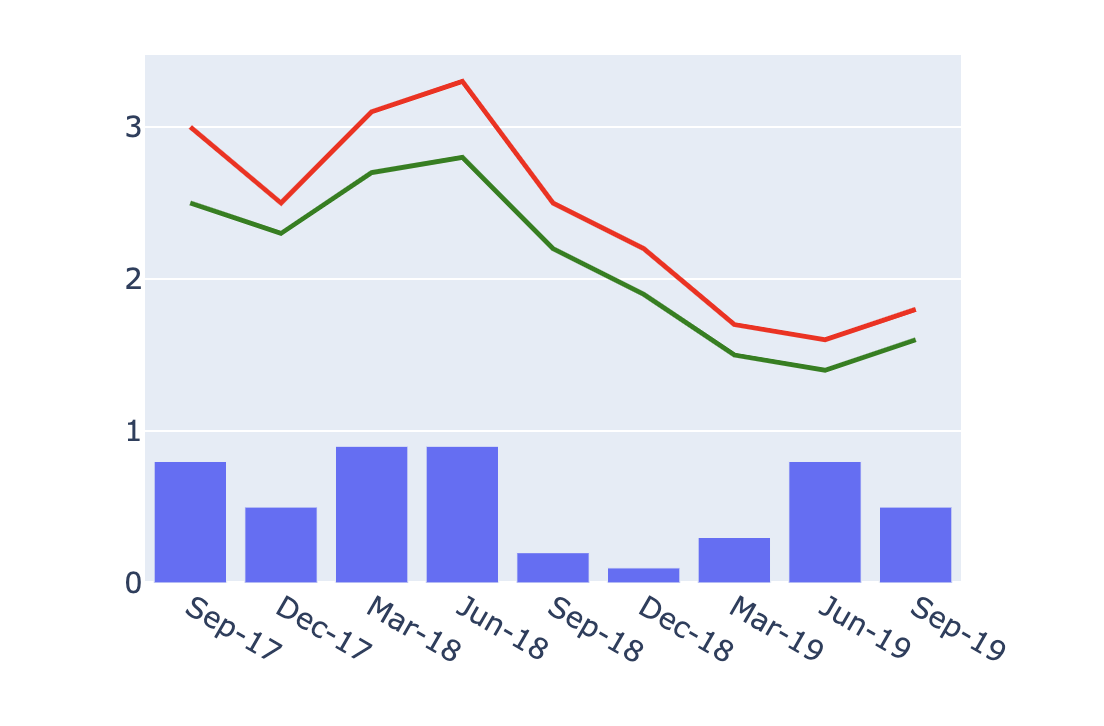
line_fig2 = px.line(df, x='Date'
    , y='OECD Average GDP Growth (%)'
    , color_discrete_sequence=['green'])

layered_fig = Figure(data=
   [*bar_fig.data
    , *line_fig.data, *line_fig2.data])
layered_fig.show()
# 生成相同的 bar_fig、line_fig line_fig2 = px.line(df, x='Date' , y='OECD Average GDP Growth (%)' , color_discrete_sequence=['green'])
layered_fig = Figure(data= [*bar_fig.data , *line_fig.data, *line_fig2.data]) layered_fig.show()
# 用两个图创建
layered_fig = Figure(data=[*bar_fig.data, *line_fig.data])

# 添加最后一条线
layered_fig.add_trace(line_fig2.data[0])
# 用两个图创建 layered_fig = Figure(data=[*bar_fig.data, *line_fig.data])
# 添加最后一条线 layered_fig.add_trace(line_fig2.data[0])