Python 中的 Plotly 数据可视化入门
Alex Scriven
Data Scientist

Plotly 的优势:
plotly.express
可这样创建 Plotly 图形:
plotly.express(px)快速出图plotly.graph_objects(go)做更多自定义$$
📈 我们主要使用 px
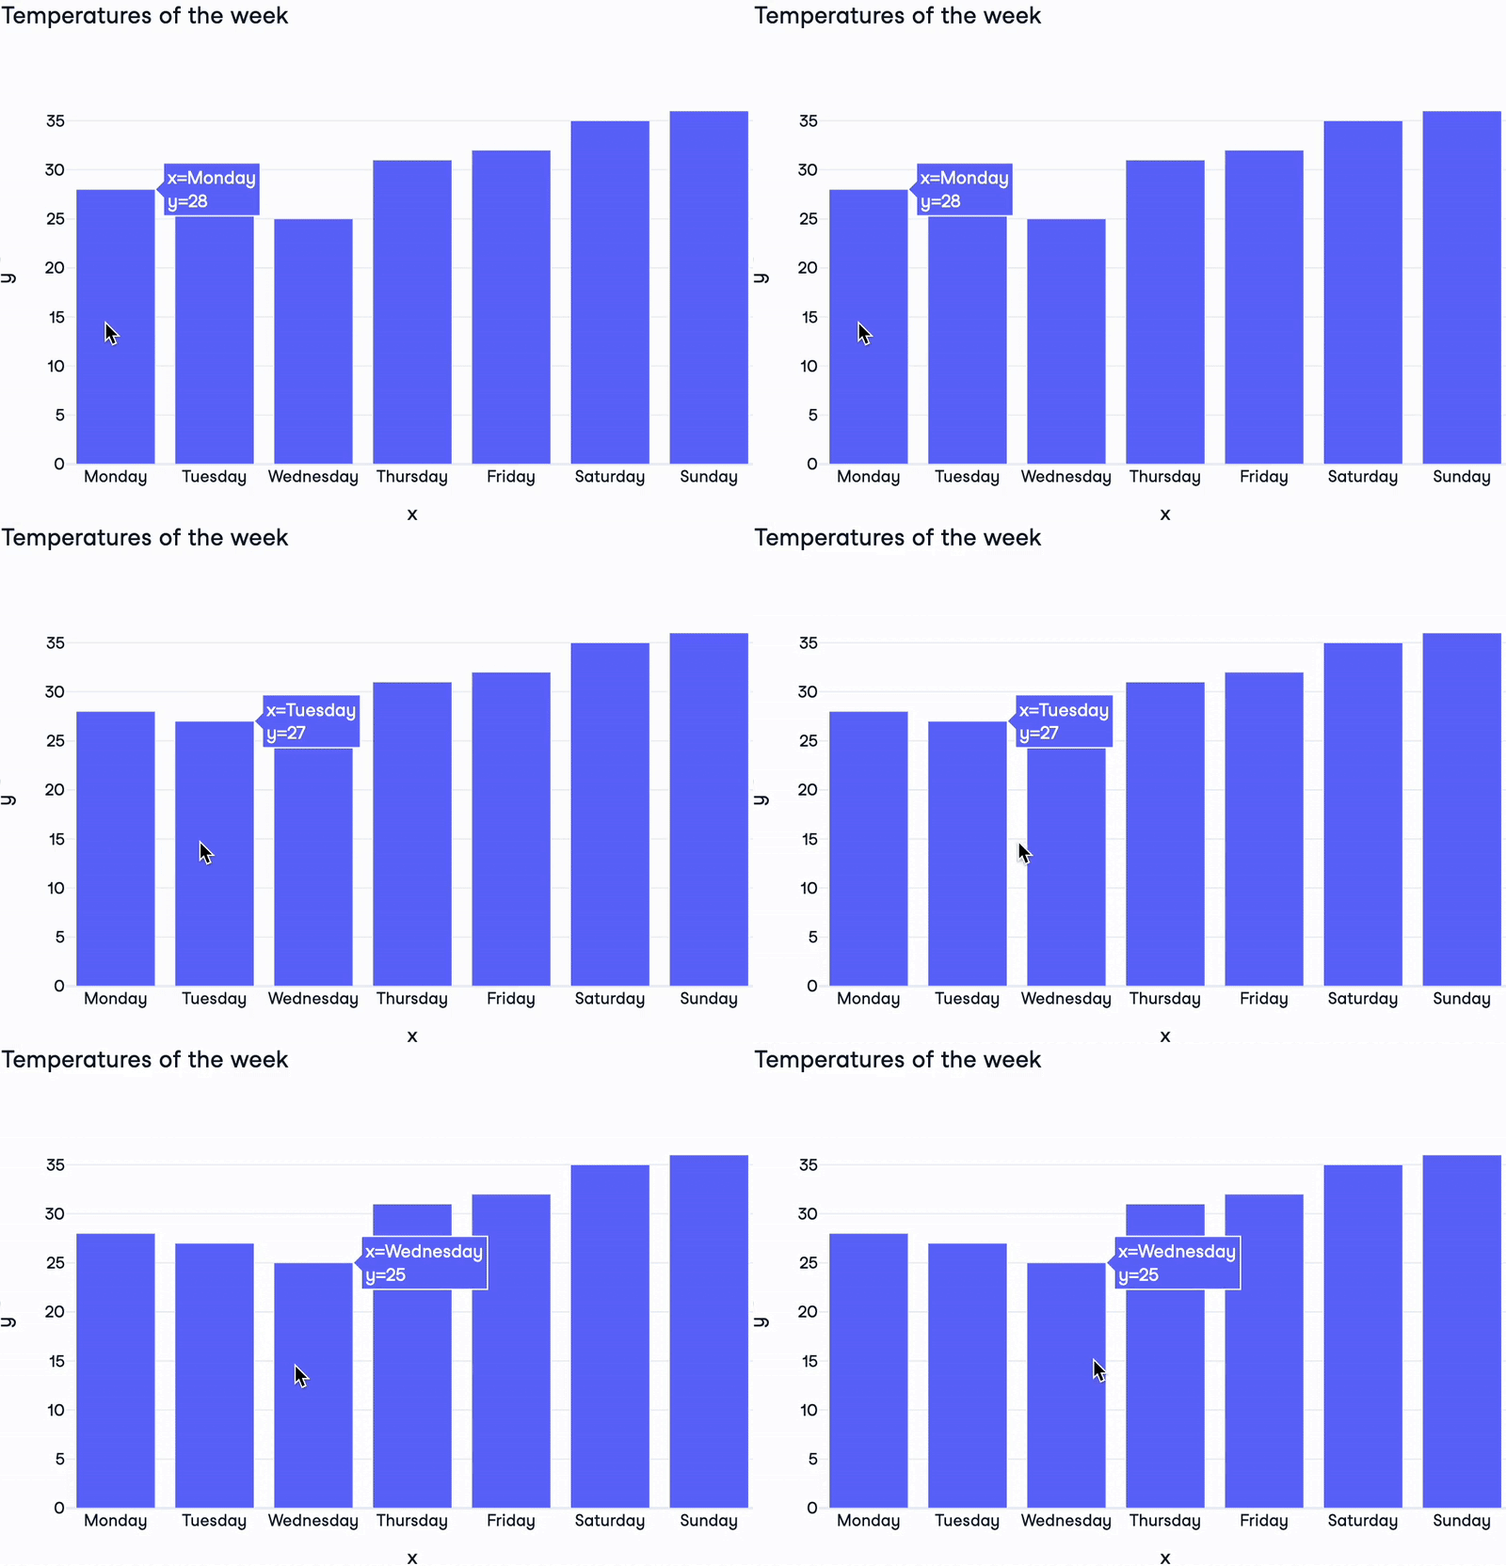
一个基础的 plotly 图形:
import plotly.express as pxdays = ["Monday", "Tuesday", "Wednesday", "Thursday", "Friday", "Saturday", "Sunday"] temperatures = [28, 27, 25, 31, 32, 35, 36]fig = px.bar( x=days, y=temperatures, title="Temperatures of the week")fig.show()

Plotly Figure 组件:
layout:控制图形样式的字典layoutdata:设置图类型与数据的字典列表trace,超过 40 种类型!frames:用于动画图(本课不涉及)
print(fig)
Figure({'data': [{'type': 'bar',
'x': array(['Monday', 'Tuesday', 'Wednesday', 'Thursday', 'Friday'
, 'Saturday','Sunday'], dtype=object),
'y': {'bdata': 'HBsZHyAjJA==....'}],
'layout': {'title': {'text': 'Temperatures of the week'}}})
$$

Python 中的 Plotly 数据可视化入门