自定义按钮

Python 中的 Plotly 数据可视化入门

Alex Scriven

Data Scientist

自定义按钮能做什么?


自定义按钮可以:

  • 更新图的 data 或 layout 元素

    • 我们的所有 update_layout() 自定义都可放进按钮!
  • 辅助动画(超出本课范围)

Python 中的 Plotly 数据可视化入门

Plotly 中的自定义按钮

通过 updatemenus 参数添加,常用参数:

  • typebuttonsdropdown
    • 下拉菜单稍后介绍
  • direction:按钮方向
    • 按钮可并排(left)或上下(down)排列
  • x/y:浮点数,设置按钮位置
  • showactiveTrue/False,是否显示被按下的 active(按钮索引)
    • 活动按钮是当前选中的按钮
  • buttonsbutton 对象列表
Python 中的 Plotly 数据可视化入门

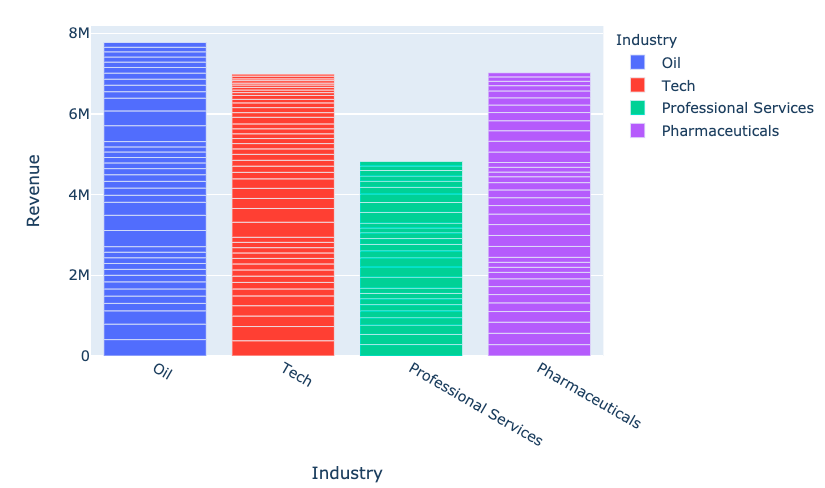
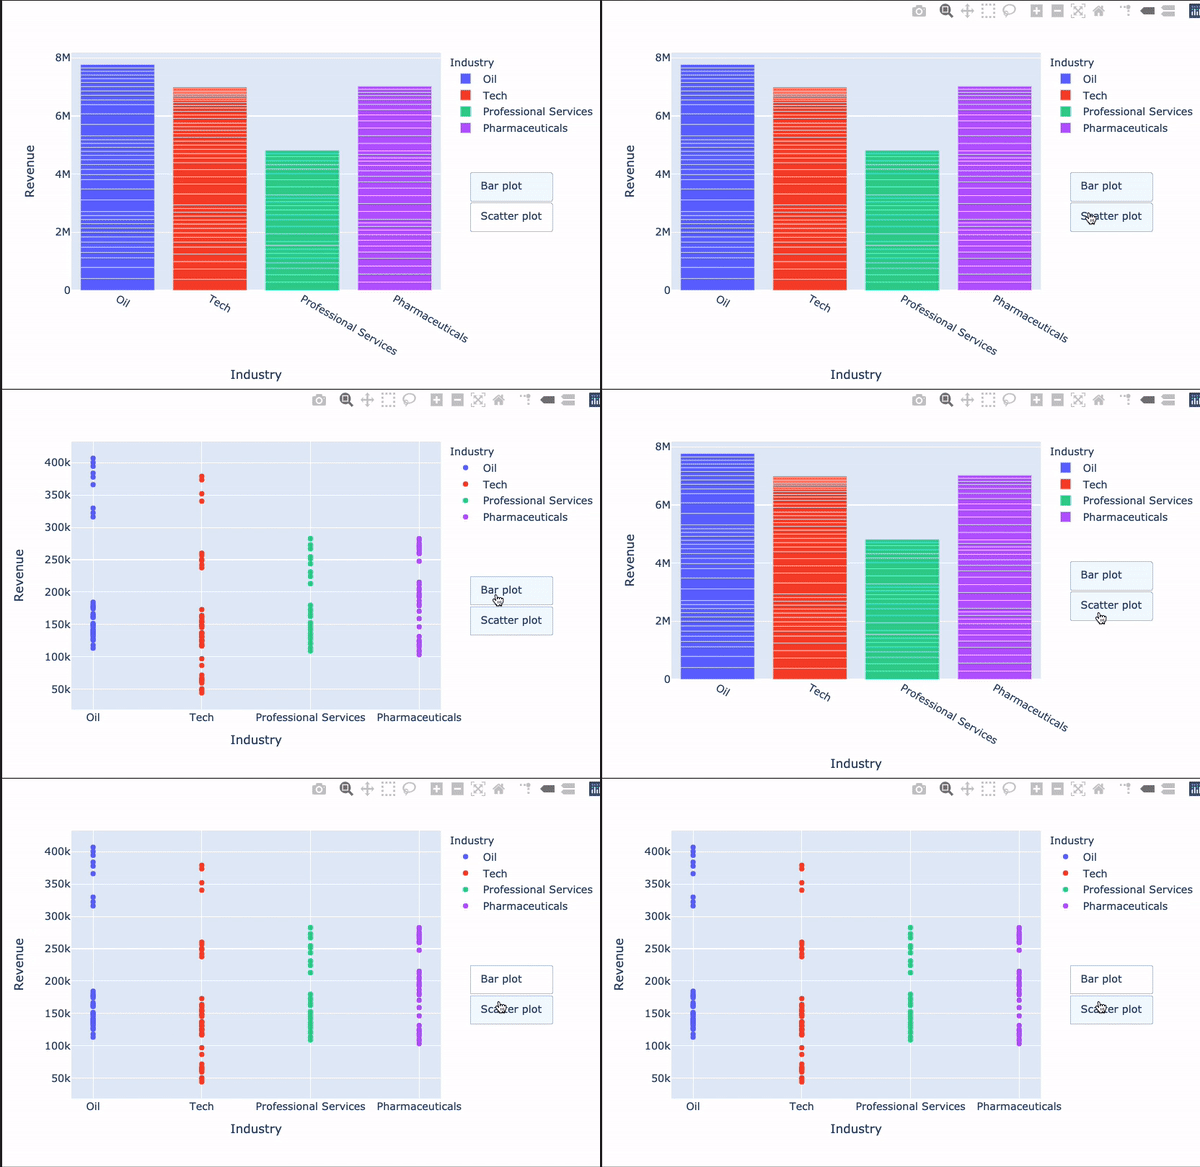
带按钮的图表类型

$$

fig = px.bar(
      data_frame=revenues, 
    x='Industry', y='Revenue',
    color='Industry')
fig.show()

按行业的简单条形图

Python 中的 Plotly 数据可视化入门

按钮设置


my_buttons = [

{'label': "Bar plot",
'method': "update",
'args': [{"type": "bar"}]},
{'label': "scatterplot",
'method': "update",
'args': [{"type": "scatter", 'mode': 'markers'}]}
]
Python 中的 Plotly 数据可视化入门

args 参数

Plotly 最让人困惑的部分之一!

  • 其结构为:

[{dictionary to send to data}, {dictionary to send to layout}]

图形内部结构

Python 中的 Plotly 数据可视化入门

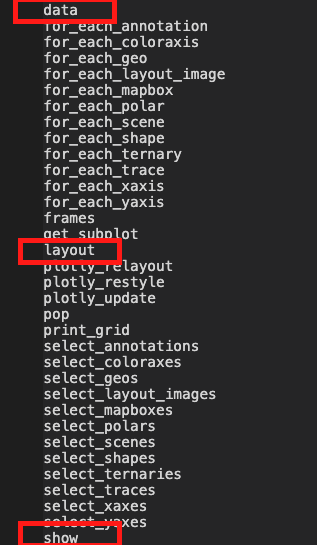
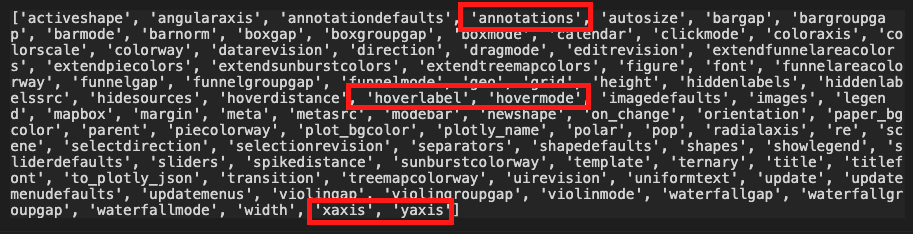
用 args 更新布局

dir(fig.layout)

图形布局元素

  • 用 'args' 更新任意参数
Python 中的 Plotly 数据可视化入门

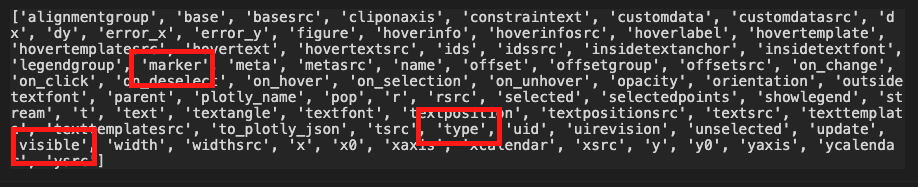
用 args 更新数据

dir(fig.data[0])

数据内部布局

  • 有些熟悉,有些稍后会用到
Python 中的 Plotly 数据可视化入门

按钮交互性

$$

fig.update_layout({
  'updatemenus': [{'type': "buttons",

'direction': 'down', 'x': 1.3, 'y': 0.5,
'showactive': True, 'active': 0,
'buttons': my_buttons}] }) fig.show()

$$

按钮

Python 中的 Plotly 数据可视化入门

¡Vamos a practicar!

Python 中的 Plotly 数据可视化入门

Preparing Video For Download...