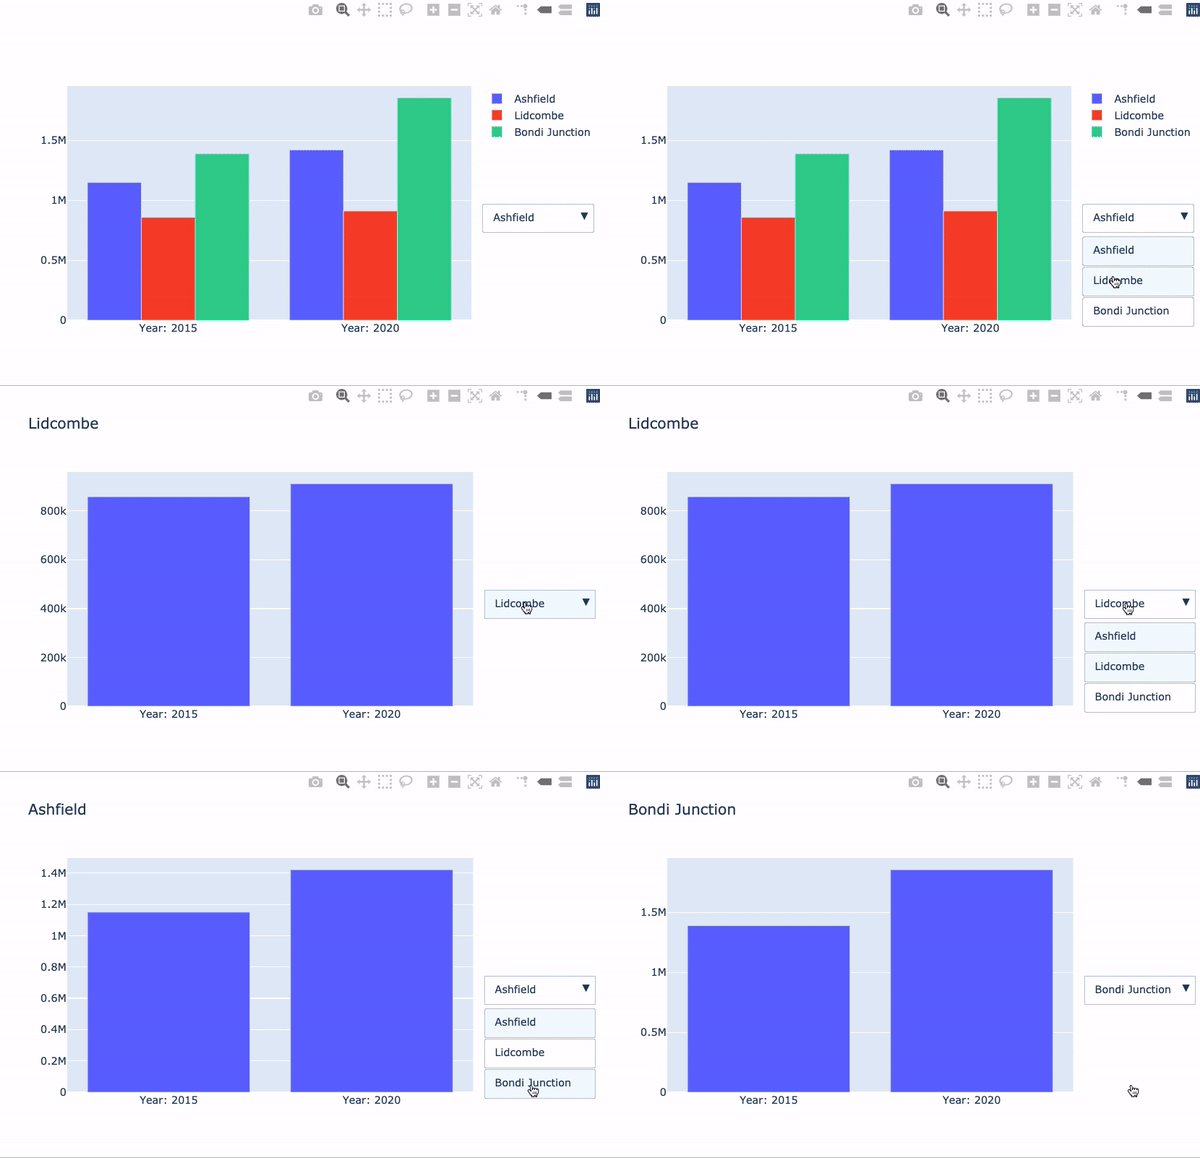
下拉菜单

Python 中的 Plotly 数据可视化入门

Alex Scriven

Data Scientist

什么是下拉菜单?


  • 允许用户从一组选项中选择

  • 可更新数据或布局元素


简单下拉菜单示例

Python 中的 Plotly 数据可视化入门

Plotly 中的下拉菜单

$$

fig = go.Figure()

for suburb in ['Ashfield', 'Lidcombe', 'Bondi Junction']: df = syd_houses[syd_houses.Suburb == suburb]
fig.add_trace( px.bar(df, x='Year', y='Median House Price').data[0])
  • 下拉菜单通过显示/隐藏特定 trace 实现
Python 中的 Plotly 数据可视化入门

隐藏 trace

$$

  • visible 参数决定 trace 是否可见(True)或不可见(False
  • 使用 args 更新不同 trace 的 visible 参数
args:[{'visible': [True, False, False]}]


数据布局内部

Python 中的 Plotly 数据可视化入门

下拉对象

# 创建下拉菜单
dropdown_buttons = [
  {'label': 'Ashfield', 'method': 'update',

'args': [{'visible': [True, False, False]}, {'title': 'Ashfield'}]},
{'label': 'Lidcombe', 'method': 'update',
'args': [{'visible': [False, True, False]}, {'title': 'Lidcombe'}]},
{'label': 'Bondi Junction', 'method': 'update',
'args': [{'visible': [False, False, True]}, {'title': 'Bondi Junction'}]}
]
Python 中的 Plotly 数据可视化入门

添加下拉菜单

$$

fig.update_layout({
  'updatemenus':[{
    'type': "dropdown",
    'x': 1.3,
    'y': 0.5,
    'showactive': True,
    'active': 0,
    'buttons': dropdown_buttons}]
})
fig.show()

$$

下拉式房价示例

Python 中的 Plotly 数据可视化入门

让我们来练习!

Python 中的 Plotly 数据可视化入门

Preparing Video For Download...