使用 .resample() 上采样与插值

Python 中的时间序列数据处理

Stefan Jansen

Founder & Lead Data Scientist at Applied Artificial Intelligence

频率转换与变换方法

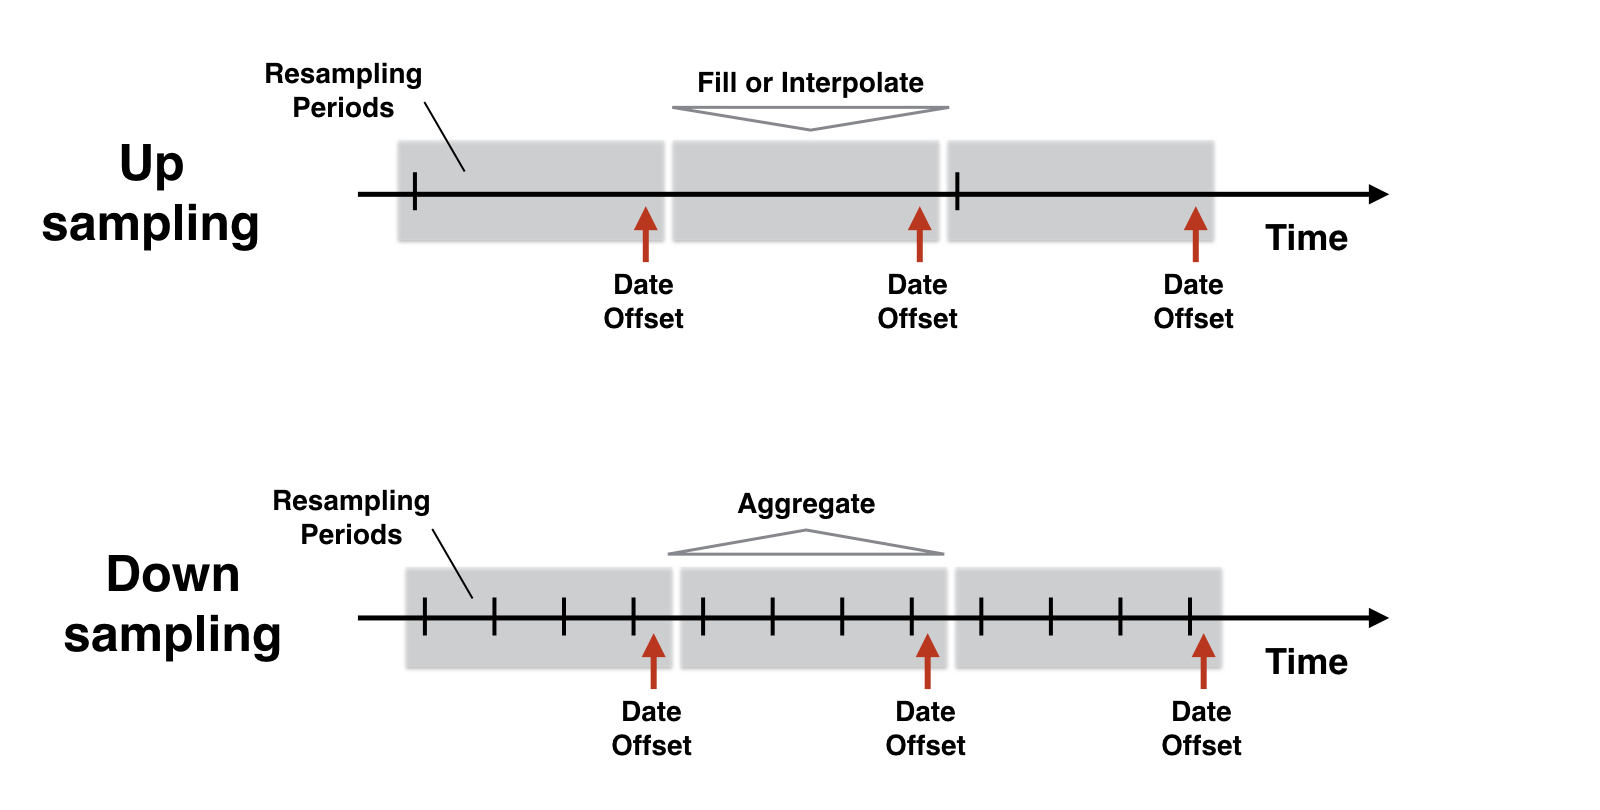
  • .resample():类似于 .groupby()

  • 在重采样周期内分组,并对每组应用一个或多个方法

  • 新日期由偏移量确定:起始、结束等

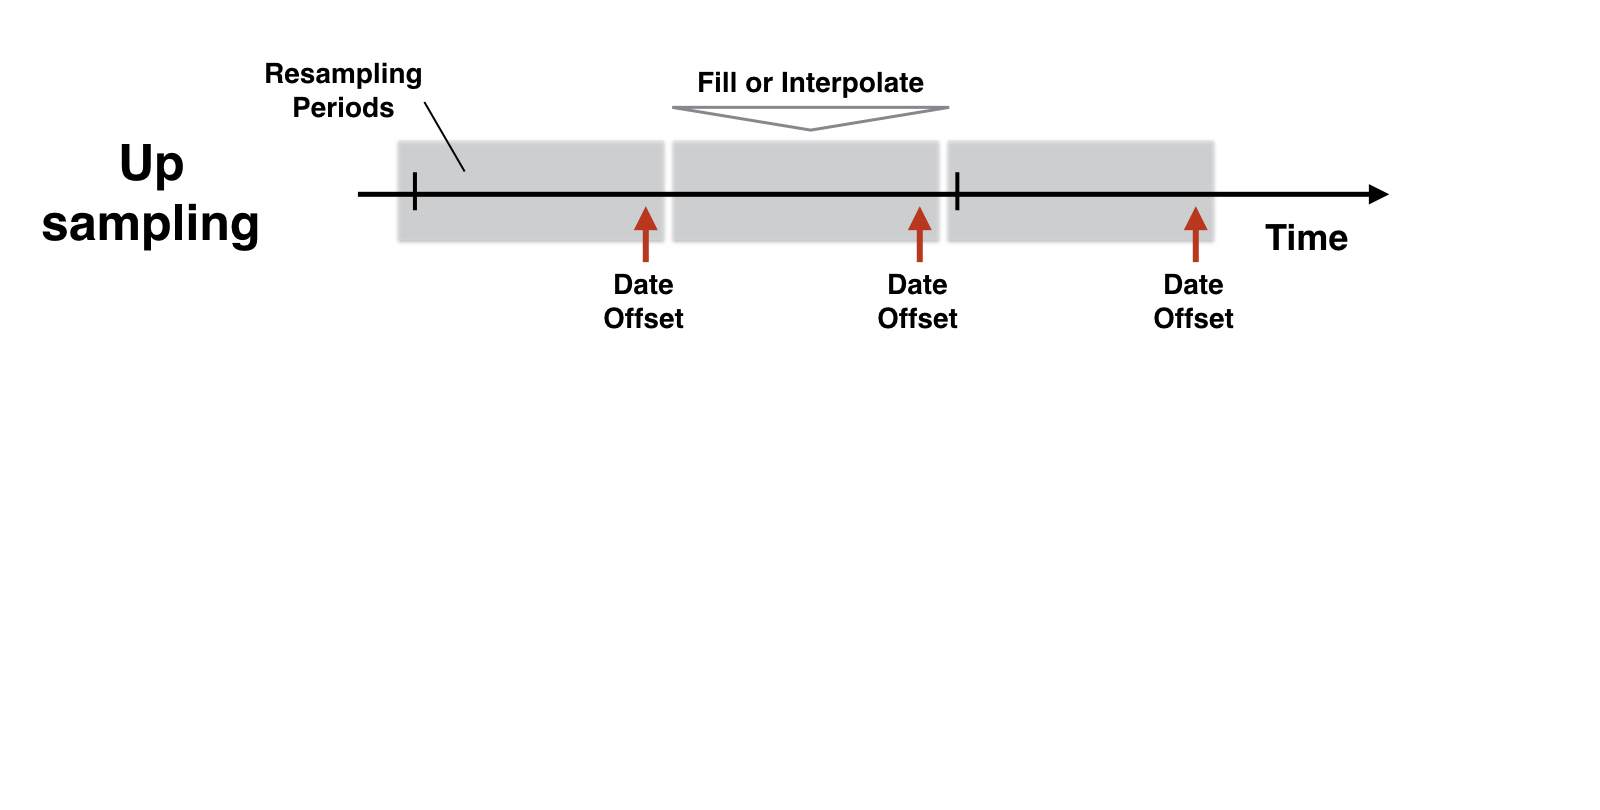
  • 上采样:从现有值填充或插值

  • 下采样:对现有数据做聚合

Python 中的时间序列数据处理

开始:月度失业率

unrate = pd.read_csv('unrate.csv', parse_dates['Date'], index_col='Date')

unrate.info()
DatetimeIndex: 208 entries, 2000-01-01 to 2017-04-01
Data columns (total 1 columns):
UNRATE    208 non-null float64 # no frequency information
dtypes: float64(1)
unrate.head()
            UNRATE
DATE
2000-01-01     4.0
2000-02-01     4.1
2000-03-01     4.0
2000-04-01     3.8
2000-05-01     4.0
  • 报告日期:每月第 1 天
Python 中的时间序列数据处理

重采样周期与频率偏移

  • 重采样根据频率偏移创建新日期
  • 多种替代于日历月末


频率 别名 示例日期
日历月末 M 2017-04-30
日历月初 MS 2017-04-01
工作月末 BM 2017-04-28
工作月初 BMS 2017-04-03
Python 中的时间序列数据处理

重采样逻辑

重采样逻辑

Python 中的时间序列数据处理

重采样逻辑

重采样逻辑

Python 中的时间序列数据处理

用 .resample() 指定频率

unrate.asfreq('MS').info()
DatetimeIndex: 208 entries, 2000-01-01 to 2017-04-01
Freq: MS
Data columns (total 1 columns):
UNRATE    208 non-null float64
dtypes: float64(1)
unrate.resample('MS') # creates Resampler object
DatetimeIndexResampler [freq=<MonthBegin>, axis=0, closed=left, 
                        label=left, convention=start, base=0]
Python 中的时间序列数据处理

用 .resample() 指定频率

unrate.asfreq('MS').equals(unrate.resample('MS').asfreq())
True
  • .resample():仅在调用其他方法时返回数据
Python 中的时间序列数据处理

季度实际 GDP 增长

gdp = pd.read_csv('gdp.csv')

gdp.info()
DatetimeIndex: 69 entries, 2000-01-01 to 2017-01-01
Data columns (total 1 columns):
gpd    69 non-null float64 # no frequency info
dtypes: float64(1)
gdp.head(2)
            gpd
DATE
2000-01-01  1.2
2000-04-01  7.8
Python 中的时间序列数据处理

插值月度实际 GDP 增长

gdp_1 = gdp.resample('MS').ffill().add_suffix('_ffill')
       gpd_ffill
DATE
2000-01-01  1.2
2000-02-01  1.2
2000-03-01  1.2
2000-04-01  7.8
Python 中的时间序列数据处理

插值月度实际 GDP 增长

gdp_2 = gdp.resample('MS').interpolate().add_suffix('_inter')
            gpd_inter
DATE
2000-01-01  1.200000
2000-02-01  3.400000
2000-03-01  5.600000
2000-04-01  7.800000
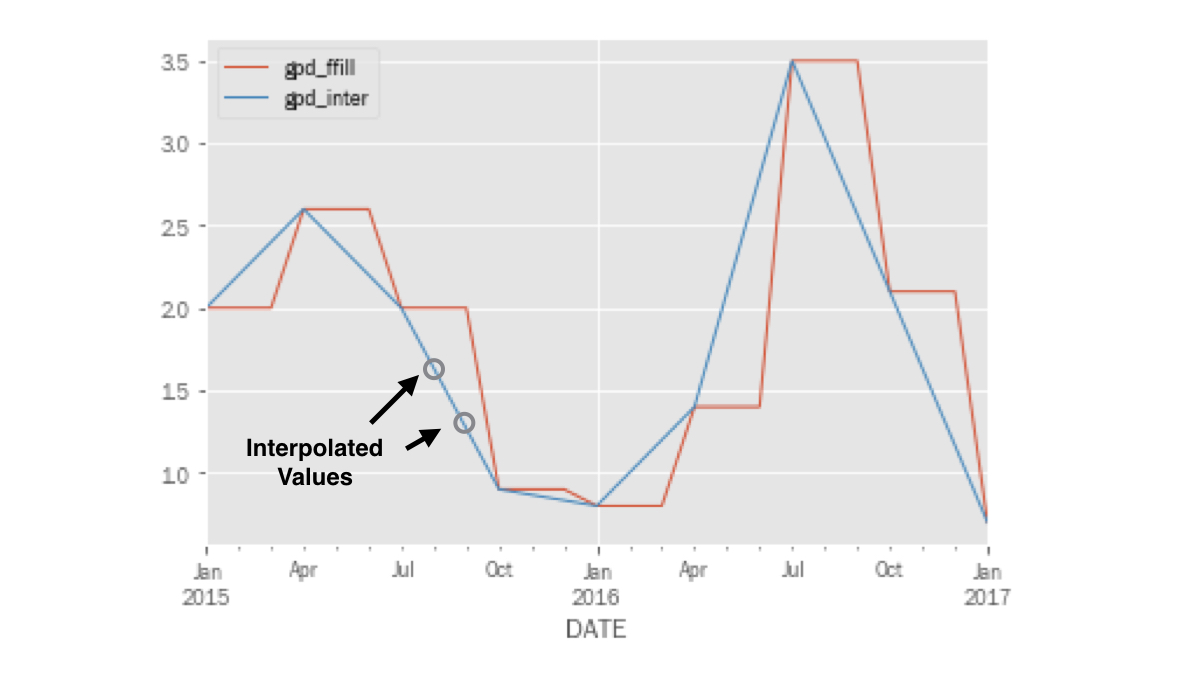
  • .interpolate():在现有数据点间按直线求值
Python 中的时间序列数据处理

连接两个 DataFrame

df1 = pd.DataFrame([1, 2, 3], columns=['df1'])

df2 = pd.DataFrame([4, 5, 6], columns=['df2'])
pd.concat([df1, df2])
   df1  df2
0  1.0  NaN
1  2.0  NaN
2  3.0  NaN
0  NaN  4.0
1  NaN  5.0
2  NaN  6.0
Python 中的时间序列数据处理

连接两个 DataFrame

pd.concat([df1, df2], axis=1)
   df1  df2
0    1    4
1    2    5
2    3    6
  • axis=1:水平连接
Python 中的时间序列数据处理

绘制插值后的实际 GDP 增长

pd.concat([gdp_1, gdp_2], axis=1).loc['2015':].plot()
ch2_3_v2 - Upsampling & Interpolation.032.png

Python 中的时间序列数据处理

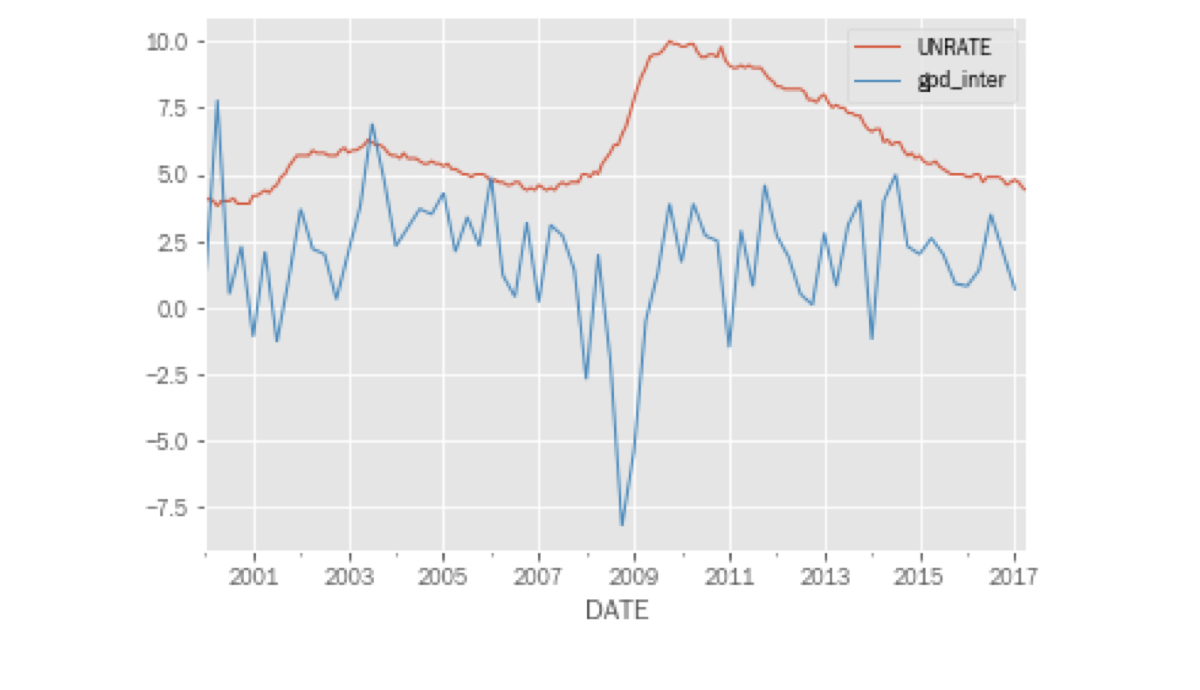
合并 GDP 增长与失业率

pd.concat([unrate, gdp_inter], axis=1).plot();
ch2_3_v2 - Upsampling & Interpolation.034.png

Python 中的时间序列数据处理

开始练习吧!

Python 中的时间序列数据处理

Preparing Video For Download...