Python 中的时间序列数据处理
Stefan Jansen
Founder & Lead Data Scientist at Applied Artificial Intelligence
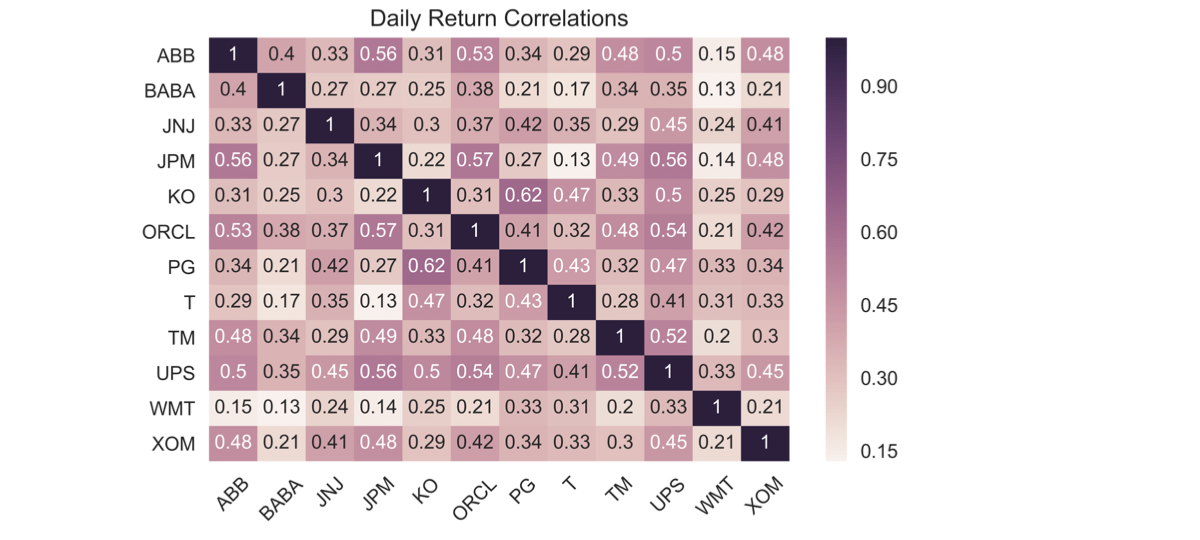
日收益率相关性:
计算所有成分间
以热力图可视化
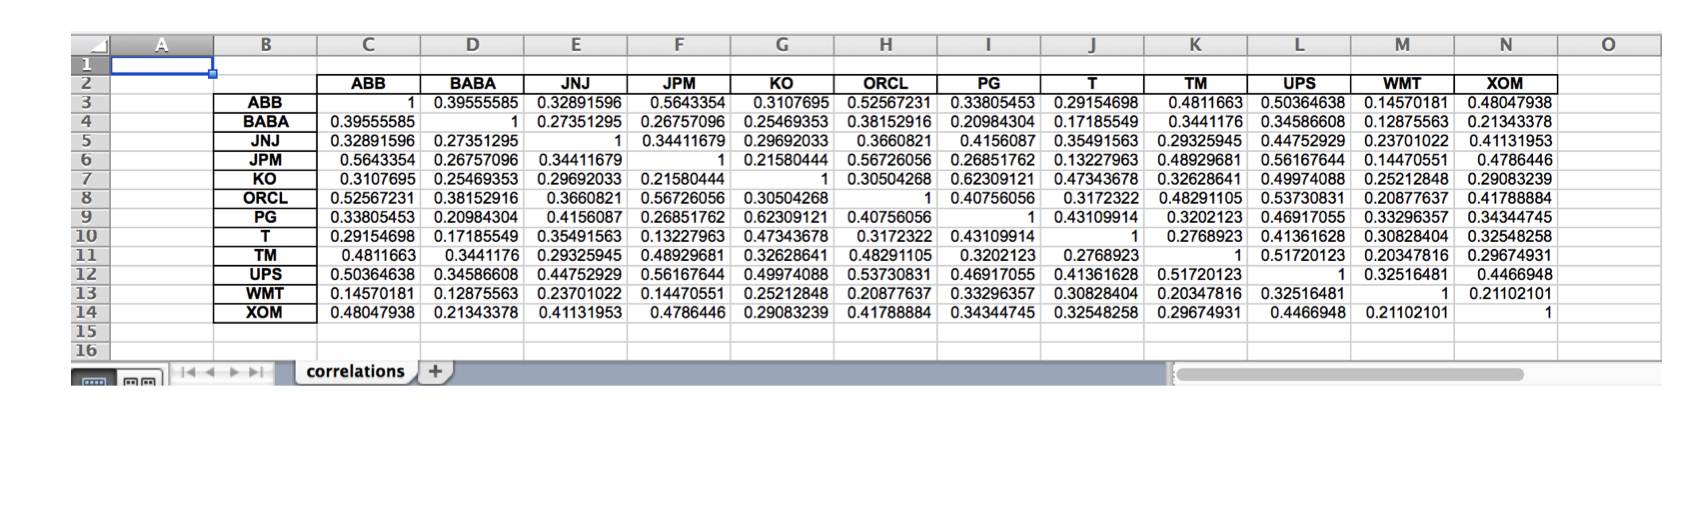
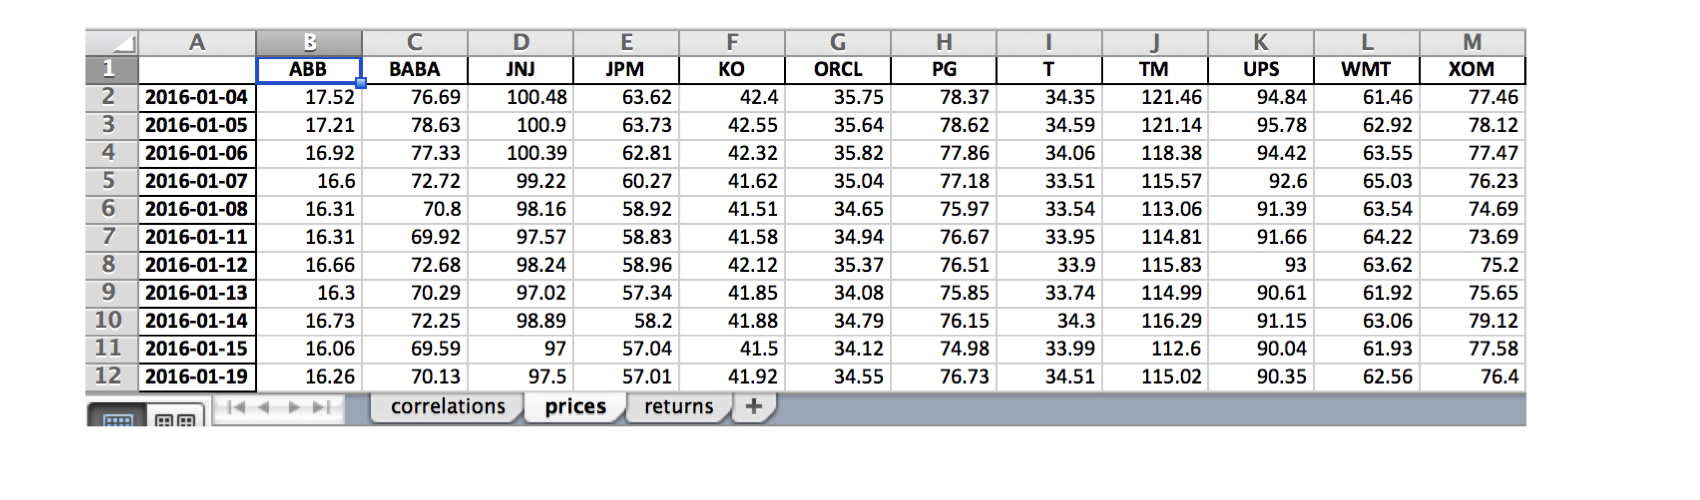
将结果写入 Excel(.xls 与 .xlsx):
单个工作表
多个工作表
data = DataReader(tickers, 'google', start='2016', end='2017')['Close']data.info()
DatetimeIndex: 252 entries, 2016-01-04 to 2016-12-30
Data columns (total 12 columns):
ABB 252 non-null float64
BABA 252 non-null float64
JNJ 252 non-null float64
JPM 252 non-null float64
KO 252 non-null float64
ORCL 252 non-null float64
PG 252 non-null float64
T 252 non-null float64
TM 252 non-null float64
UPS 252 non-null float64
WMT 252 non-null float64
XOM 252 non-null float64
daily_returns = data.pct_change()correlations = daily_returns.corr()
ABB BABA JNJ JPM KO ORCL PG T TM UPS WMT XOM
ABB 1.00 0.40 0.33 0.56 0.31 0.53 0.34 0.29 0.48 0.50 0.15 0.48
BABA 0.40 1.00 0.27 0.27 0.25 0.38 0.21 0.17 0.34 0.35 0.13 0.21
JNJ 0.33 0.27 1.00 0.34 0.30 0.37 0.42 0.35 0.29 0.45 0.24 0.41
JPM 0.56 0.27 0.34 1.00 0.22 0.57 0.27 0.13 0.49 0.56 0.14 0.48
KO 0.31 0.25 0.30 0.22 1.00 0.31 0.62 0.47 0.33 0.50 0.25 0.29
ORCL 0.53 0.38 0.37 0.57 0.31 1.00 0.41 0.32 0.48 0.54 0.21 0.42
PG 0.34 0.21 0.42 0.27 0.62 0.41 1.00 0.43 0.32 0.47 0.33 0.34
T 0.29 0.17 0.35 0.13 0.47 0.32 0.43 1.00 0.28 0.41 0.31 0.33
TM 0.48 0.34 0.29 0.49 0.33 0.48 0.32 0.28 1.00 0.52 0.20 0.30
UPS 0.50 0.35 0.45 0.56 0.50 0.54 0.47 0.41 0.52 1.00 0.33 0.45
WMT 0.15 0.13 0.24 0.14 0.25 0.21 0.33 0.31 0.20 0.33 1.00 0.21
XOM 0.48 0.21 0.41 0.48 0.29 0.42 0.34 0.33 0.30 0.45 0.21 1.00
sns.heatmap(correlations, annot=True)
plt.xticks(rotation=45)
plt.title('Daily Return Correlations')
correlations.to_excel(excel_writer= 'correlations.xls',
sheet_name='correlations',
startrow=1,
startcol=1)
data.index = data.index.date # Keep only date componentwith pd.ExcelWriter('stock_data.xlsx') as writer:corr.to_excel(excel_writer=writer, sheet_name='correlations')data.to_excel(excel_writer=writer, sheet_name='prices')data.pct_change().to_excel(writer, sheet_name='returns')
Python 中的时间序列数据处理