使用 pandas 的滚动窗口函数

Python 中的时间序列数据处理

Stefan Jansen

Founder & Lead Data Scientist at Applied Artificial Intelligence

pandas 中的窗口函数

  • 窗口标识时间序列的子区间
  • 在窗口内计算子区间指标
  • 生成新的指标时间序列
  • 两类窗口:
    • 滚动:固定大小,滑动(本视频)
    • 累积:包含之前所有值(下个视频)
Python 中的时间序列数据处理

计算滚动平均

data = pd.read_csv('google.csv', parse_dates=['date'], index_col='date')
DatetimeIndex: 1761 entries, 2010-01-04 to 2016-12-30
Data columns (total 1 columns):
price     1761 non-null float64
dtypes: float64(1)

ch3_1_v2 - 使用 Pandas 的滚动窗口函数.010.png

Python 中的时间序列数据处理

计算滚动平均

# 基于整数的窗口大小
data.rolling(window=30).mean() # 固定观测数
DatetimeIndex: 1761 entries, 2010-01-04 to 2017-05-24
Data columns (total 1 columns):
price    1732 non-null float64
dtypes: float64(1)
  • window=30:工作日天数
  • min_periods:设为 < 30 以获得前几天结果
Python 中的时间序列数据处理

计算滚动平均

# 基于偏移量的窗口大小
data.rolling(window='30D').mean() # 固定周期长度
DatetimeIndex: 1761 entries, 2010-01-04 to 2017-05-24
Data columns (total 1 columns):
price    1761 non-null float64
dtypes: float64(1)
  • 30D:自然日天数
Python 中的时间序列数据处理

90 天滚动均值

r90 = data.rolling(window='90D').mean()

google.join(r90.add_suffix('_mean_90')).plot()
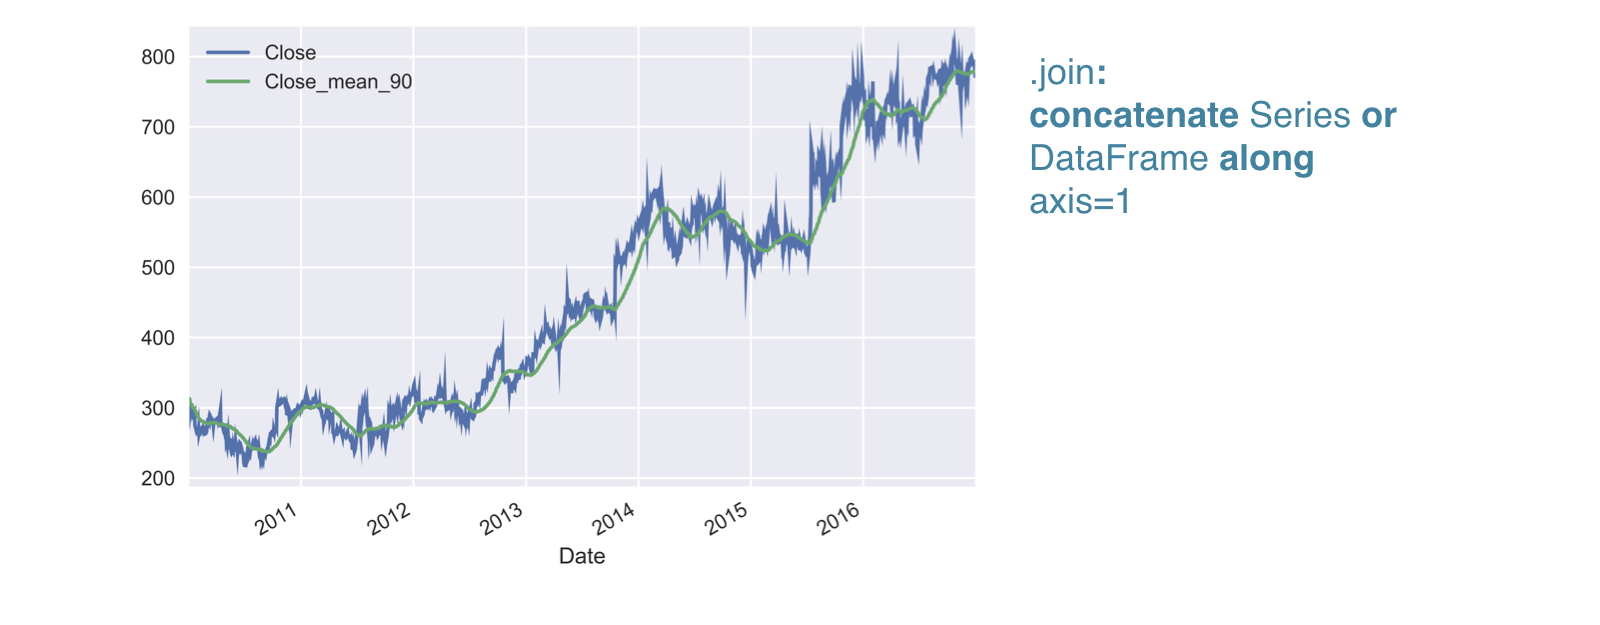
ch3_1_v2 - 使用 Pandas 的滚动窗口函数.017.png

Python 中的时间序列数据处理

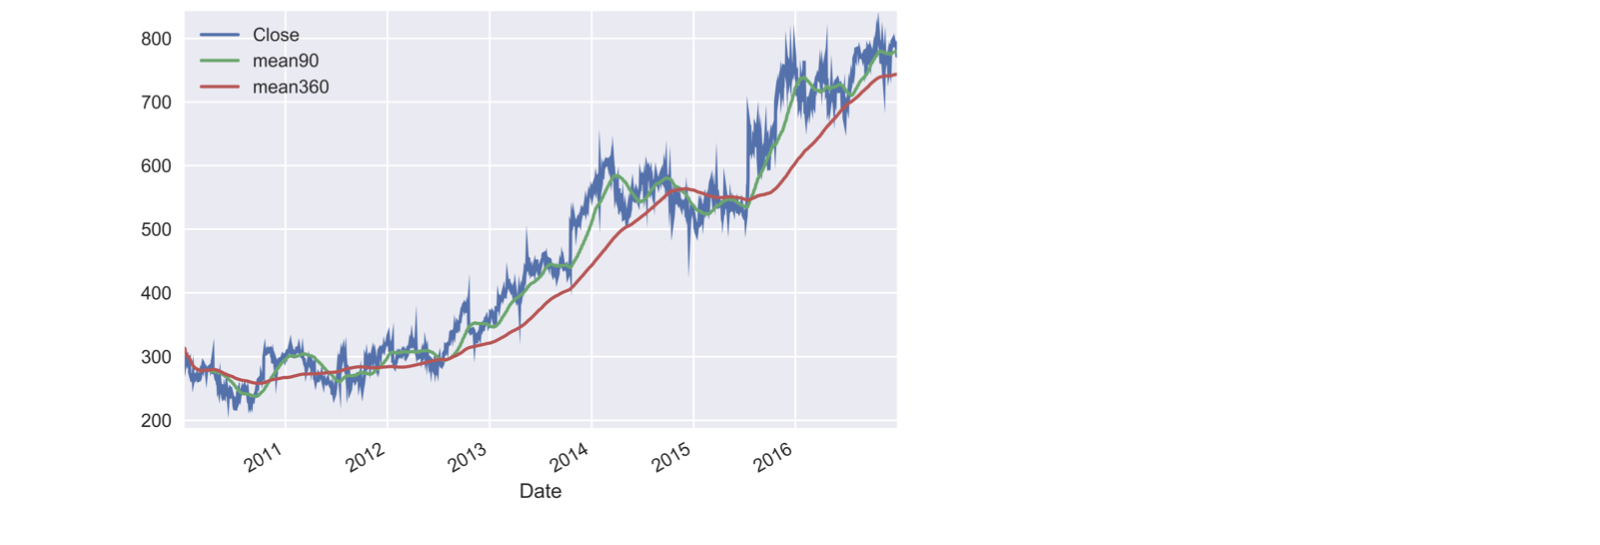
90 与 360 天滚动均值

data['mean90'] = r90

r360 = data['price'].rolling(window='360D'.mean()
data['mean360'] = r360; data.plot()

ch3_1_v2 - 使用 Pandas 的滚动窗口函数.020.png

Python 中的时间序列数据处理

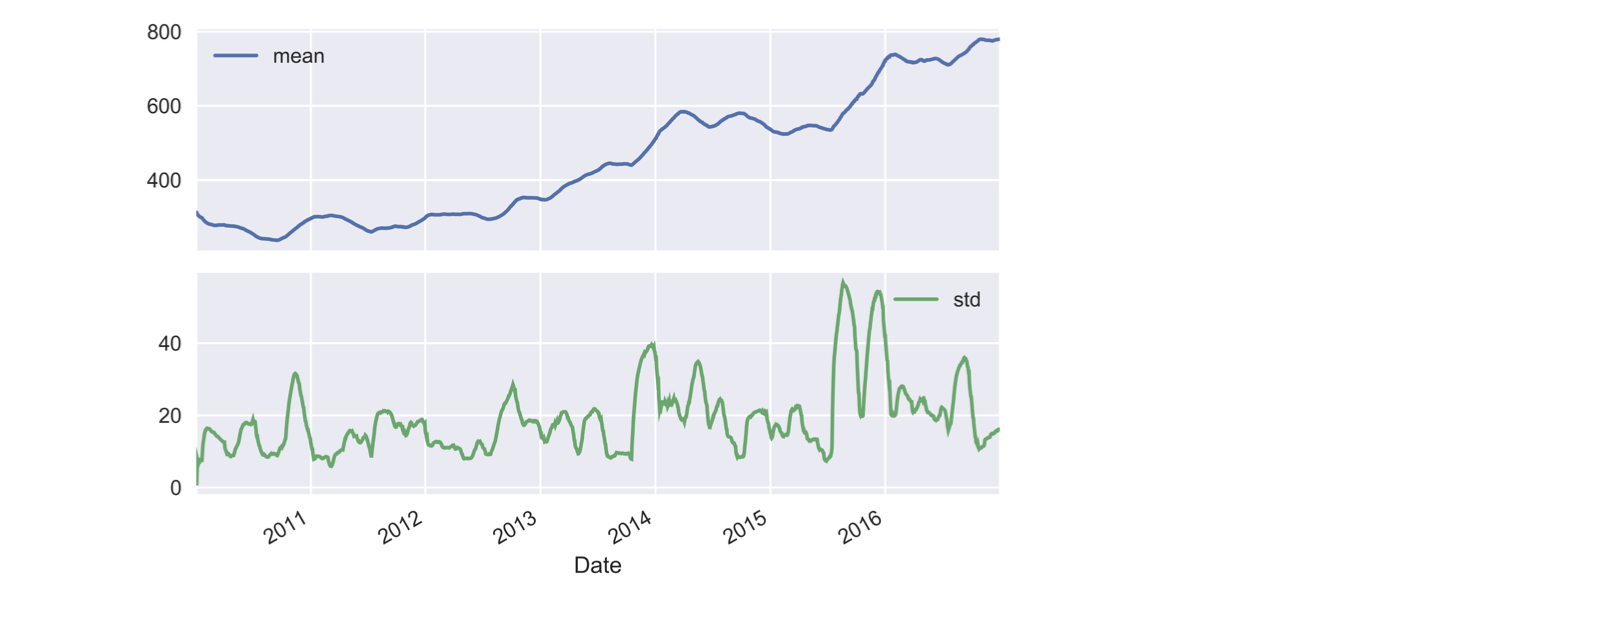
多种滚动指标(1)

r = data.price.rolling('90D').agg(['mean', 'std'])

r.plot(subplots = True)

ch3_1_v2 - 使用 Pandas 的滚动窗口函数.022.png

Python 中的时间序列数据处理

多种滚动指标(2)

rolling = data.google.rolling('360D')

q10 = rolling.quantile(0.1).to_frame('q10')
median = rolling.median().to_frame('median')
q90 = rolling.quantile(0.9).to_frame('q90')
pd.concat([q10, median, q90], axis=1).plot()
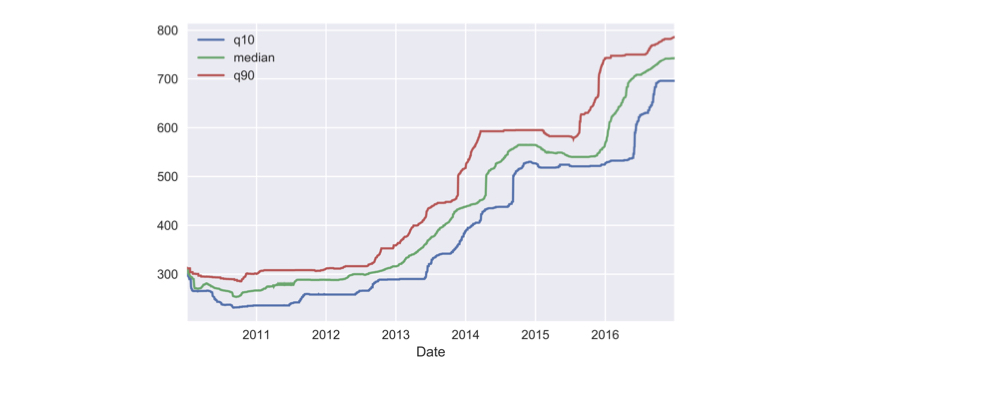
ch3_1_v2 - 使用 Pandas 的滚动窗口函数.024.png

Python 中的时间序列数据处理

Passons à la pratique !

Python 中的时间序列数据处理

Preparing Video For Download...