评估指数表现

Python 中的时间序列数据处理

Stefan Jansen

Founder & Lead Data Scientist at Applied Artificial Intelligence

评估你的市值加权指数

  • 指数收益:

    • 指数总收益

    • 各成分贡献

  • 相对基准的表现

    • 整个周期收益

    • 子周期滚动收益

Python 中的时间序列数据处理

市值加权指数回顾

agg_market_cap = market_cap_series.sum(axis=1)

index = agg_market_cap.div(agg_market_cap.iloc[0]).mul(100)
index.plot(title='Market-Cap Weighted Index')
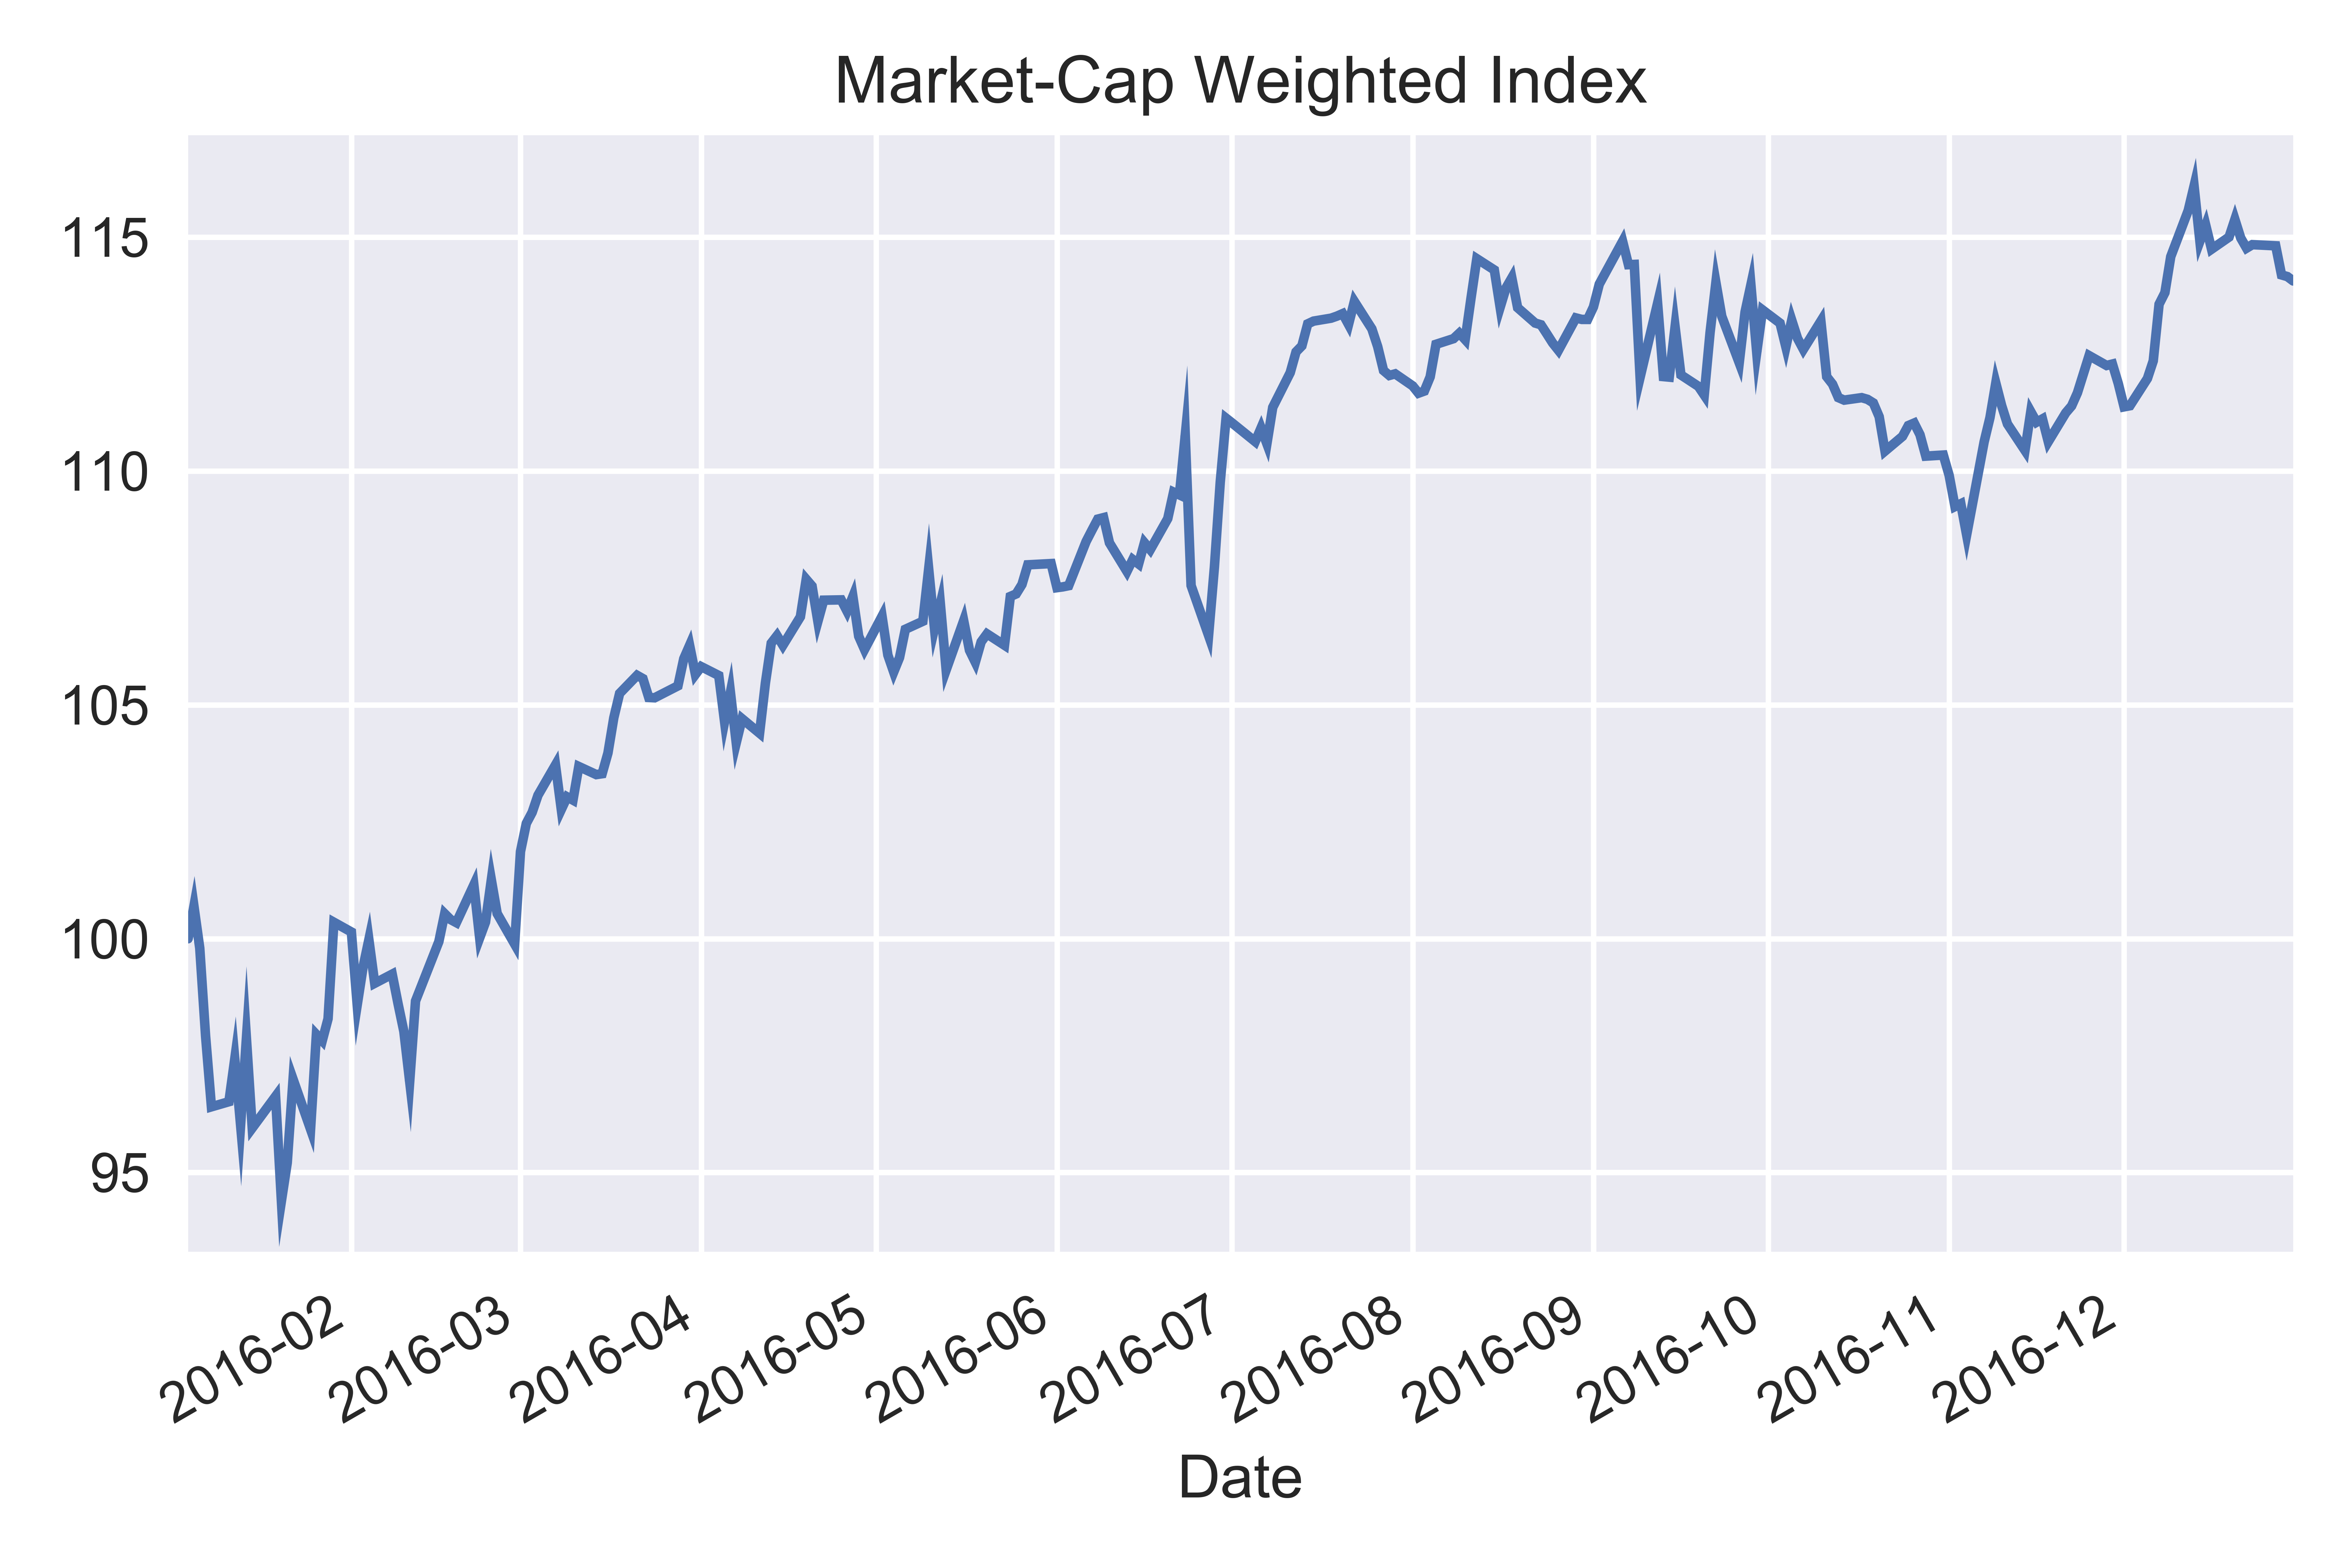
指数折线图

Python 中的时间序列数据处理

按股票的价值贡献

agg_market_cap.iloc[-1] - agg_market_cap.iloc[0]
315,037.71
Python 中的时间序列数据处理

按股票的价值贡献

change = market_cap_series.first('D').append(market_cap_series.last('D'))

change.diff().iloc[-1].sort_values() # or: .loc('2016-12-30')
TM     -6,365.07
KO     -4,034.49
ABB     7,592.41
ORCL   11,109.65
PG     14,597.48
UPS    17,212.08
WMT    23,232.85
BABA   27,800.00
JNJ    39,931.44
T      50,229.33
XOM    53,075.38
JPM    80,656.65
Name: 2016-12-30 00:00:00, dtype: float64
Python 中的时间序列数据处理

基于市值的权重

market_cap = components['Market Capitalization']

weights = market_cap.div(market_cap.sum())
weights.sort_values().mul(100)
Stock Symbol
ABB     1.85
UPS     3.45
TM      5.96
ORCL    6.93
KO      7.03
WMT     8.50
PG      8.81
T       9.47
BABA   10.55
JPM    11.50
XOM    12.97
JNJ    12.97
Name: Market Capitalization, dtype: float64
Python 中的时间序列数据处理

按市值加权的成分收益

index_return = (index.iloc[-1] / index.iloc[0] - 1) * 100
14.06
weighted_returns = weights.mul(index_return)

weighted_returns.sort_values().plot(kind='barh')
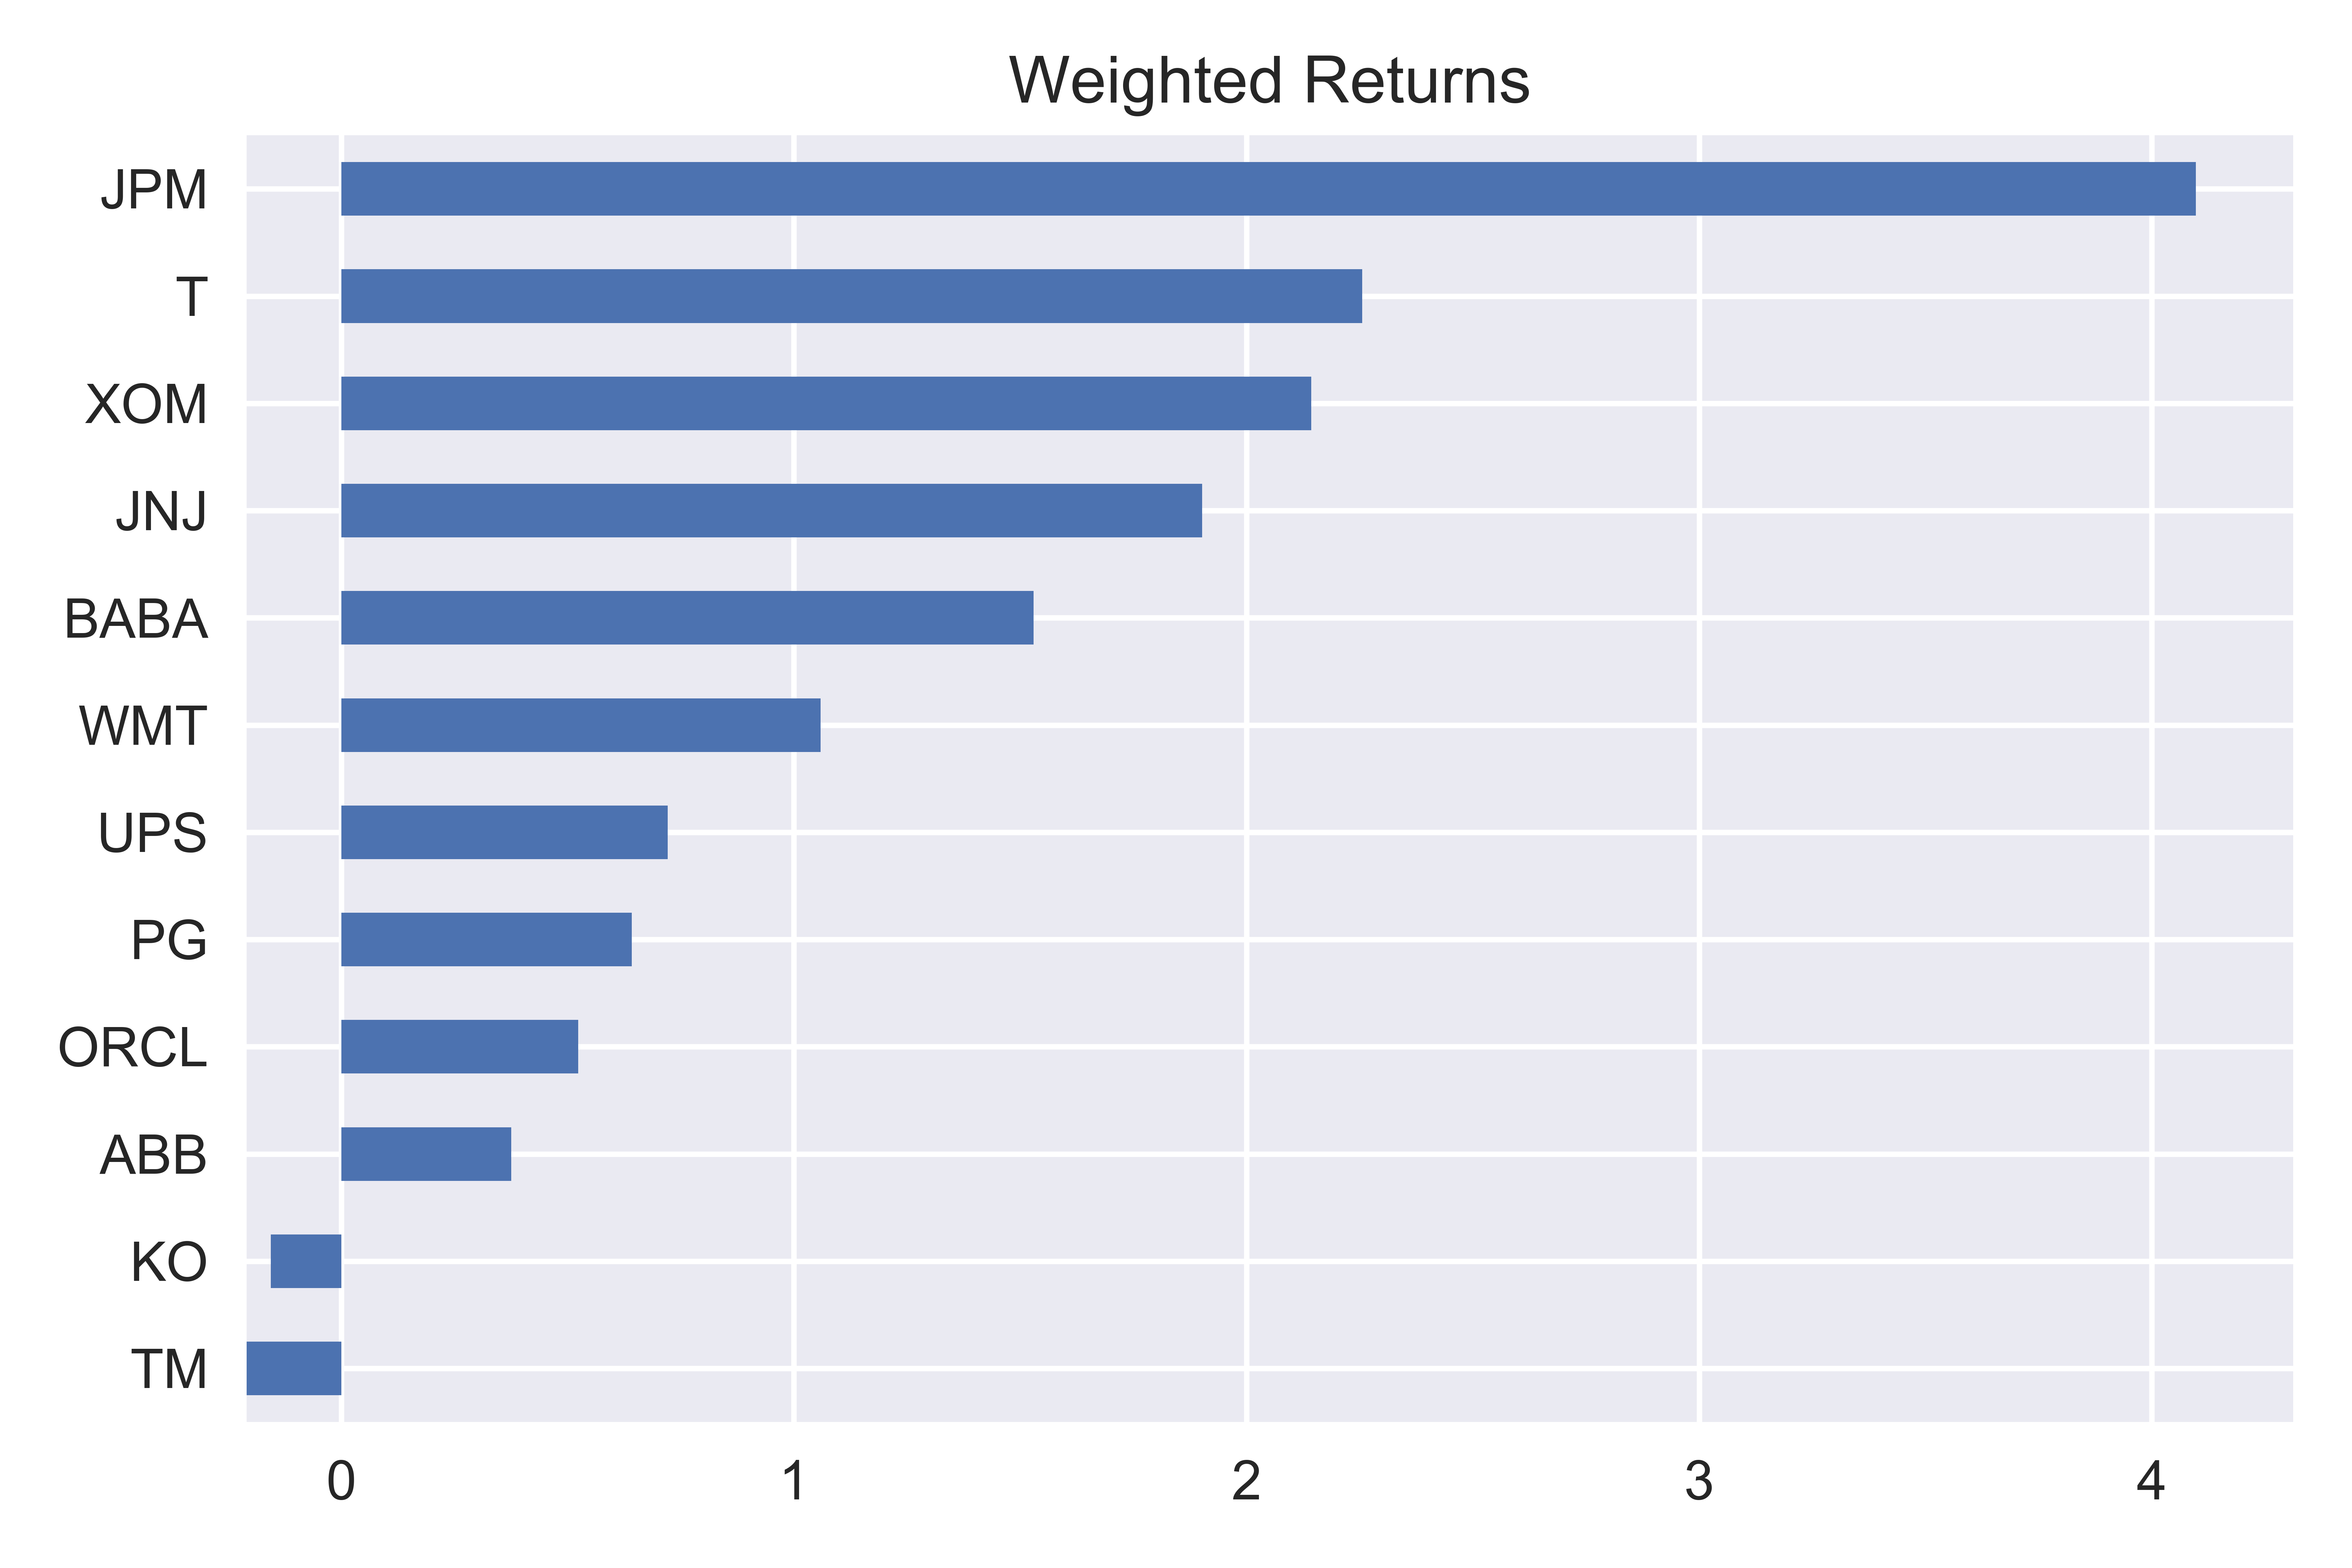
加权收益条形图

Python 中的时间序列数据处理

与基准的表现对比

data = index.to_frame('Index') # Convert pd.Series to pd.DataFrame

data['SP500'] = pd.read_csv('sp500.csv', parse_dates=['Date'], index_col='Date')
data.SP500 = data.SP500.div(data.SP500.iloc[0], axis=0).mul(100)
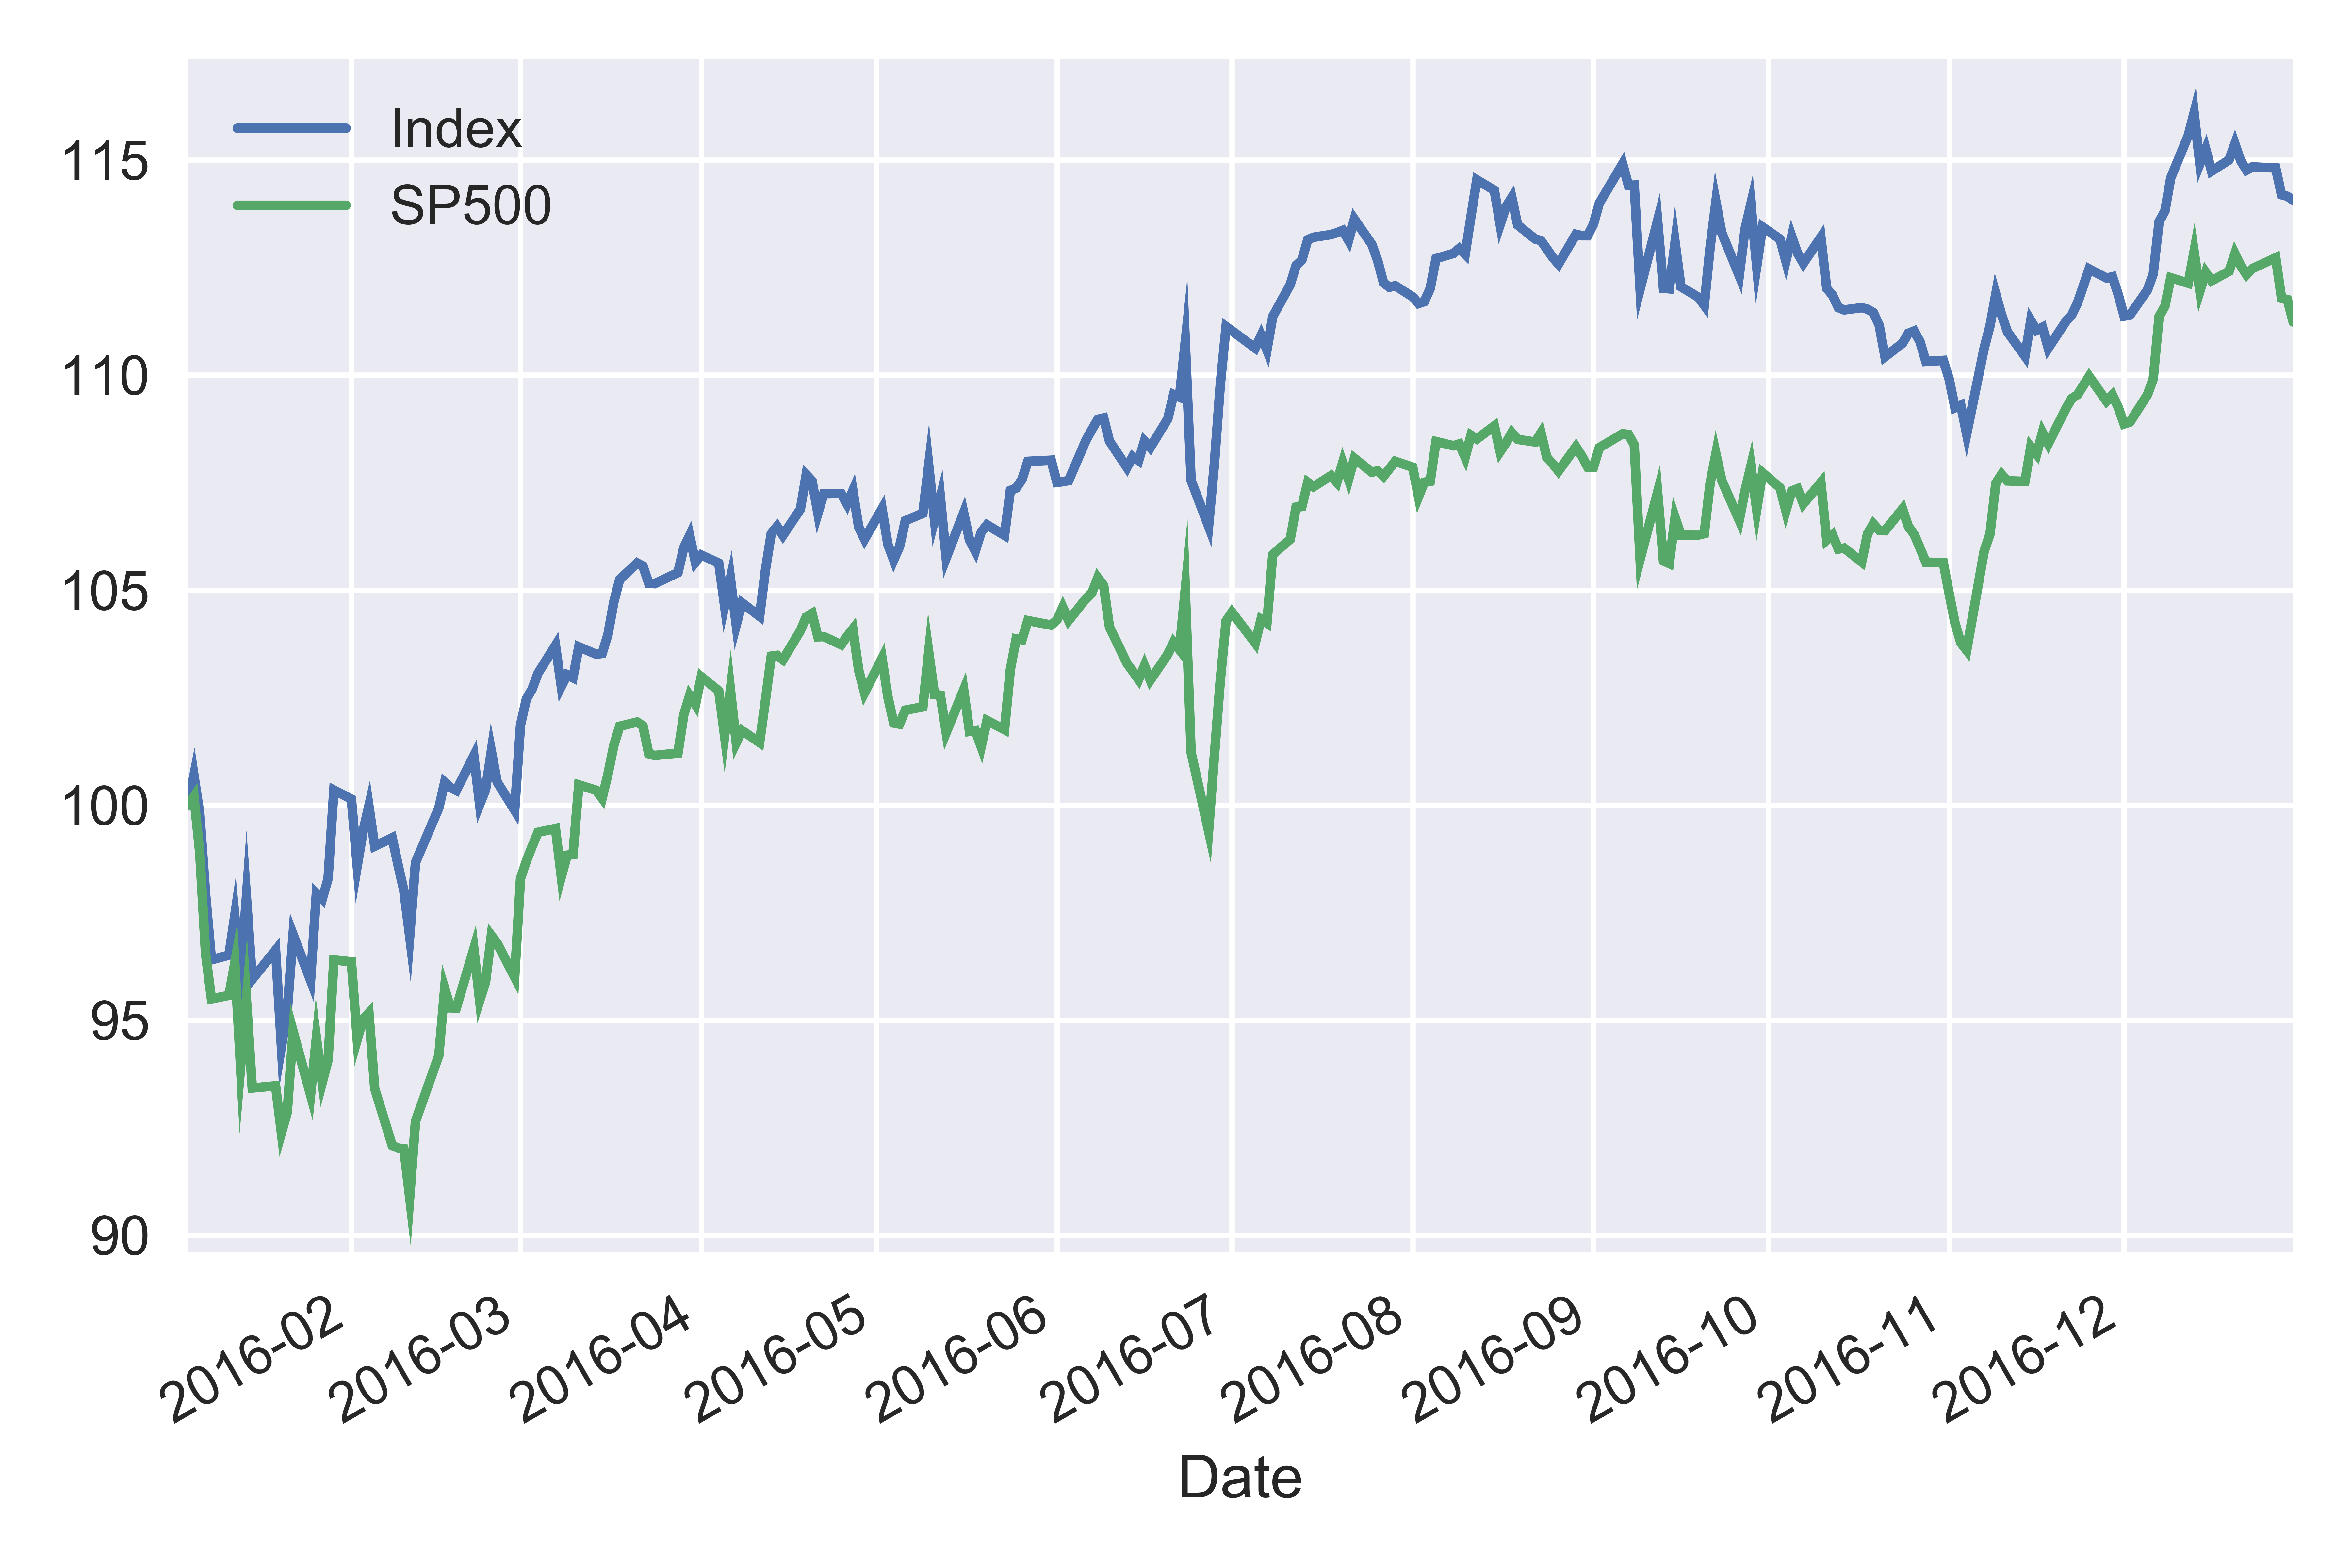
指数与标普500对比图

Python 中的时间序列数据处理

与基准对比:30天滚动收益

def multi_period_return(r):
    return (np.prod(r + 1) - 1) * 100

data.pct_change().rolling('30D').apply(multi_period_return).plot()
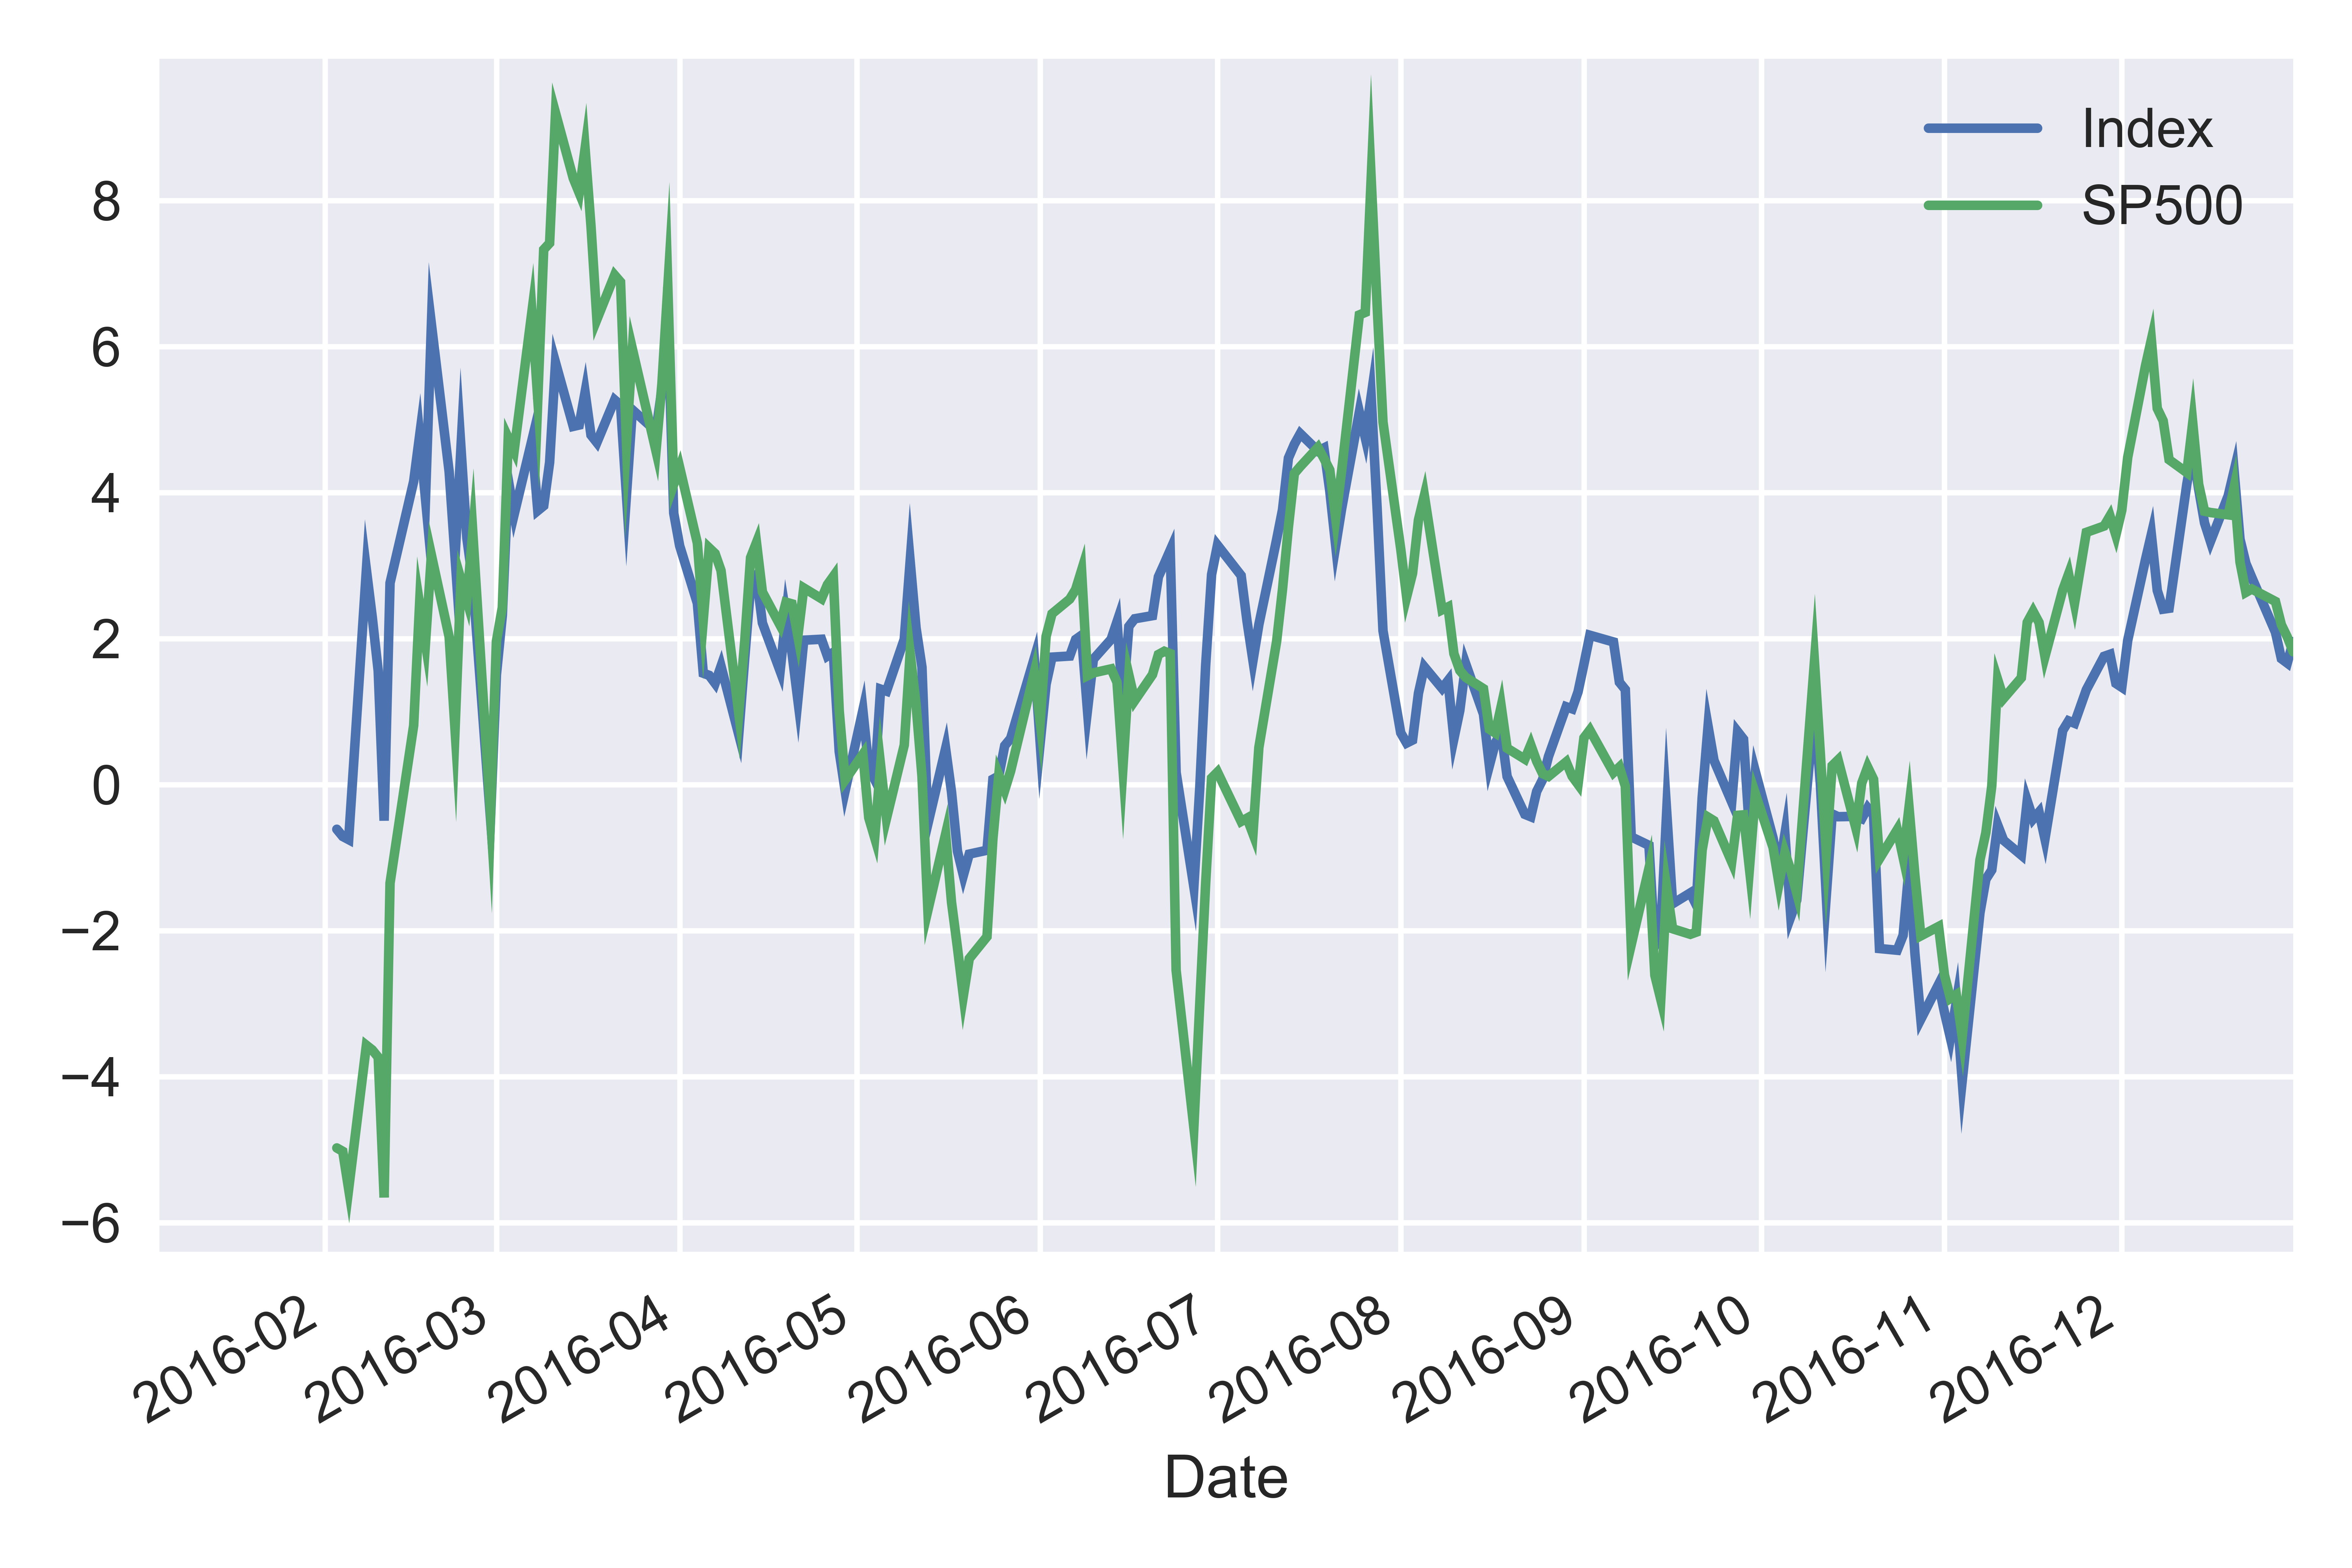
指数与标普500的30天滚动收益

Python 中的时间序列数据处理

Passons à la pratique !

Python 中的时间序列数据处理

Preparing Video For Download...