R 中的抽样
Richie Cotton
Data Evangelist at DataCamp
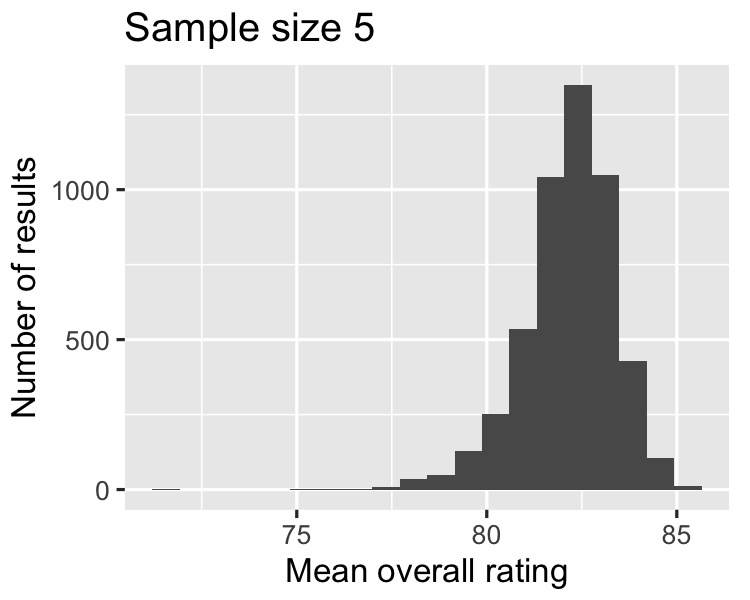
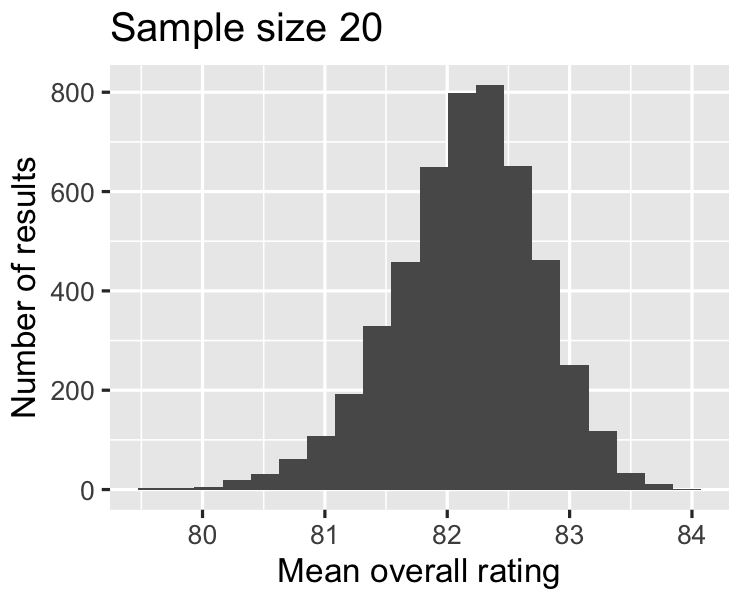
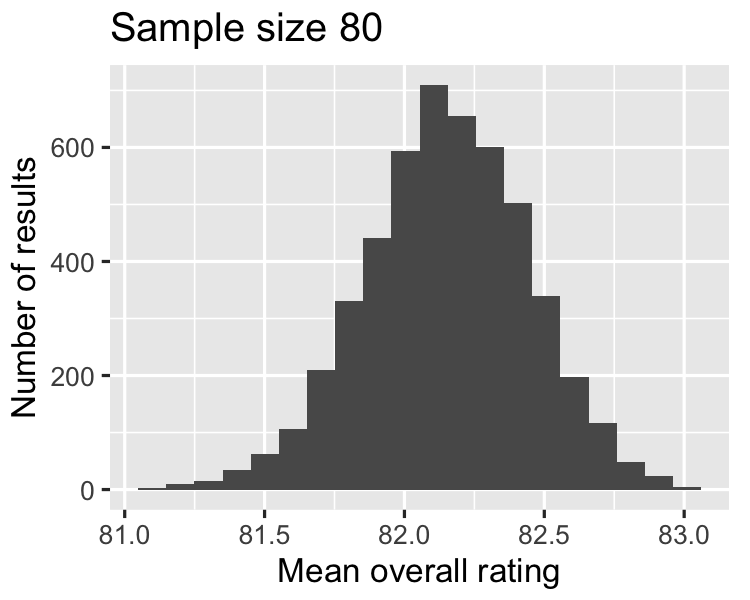
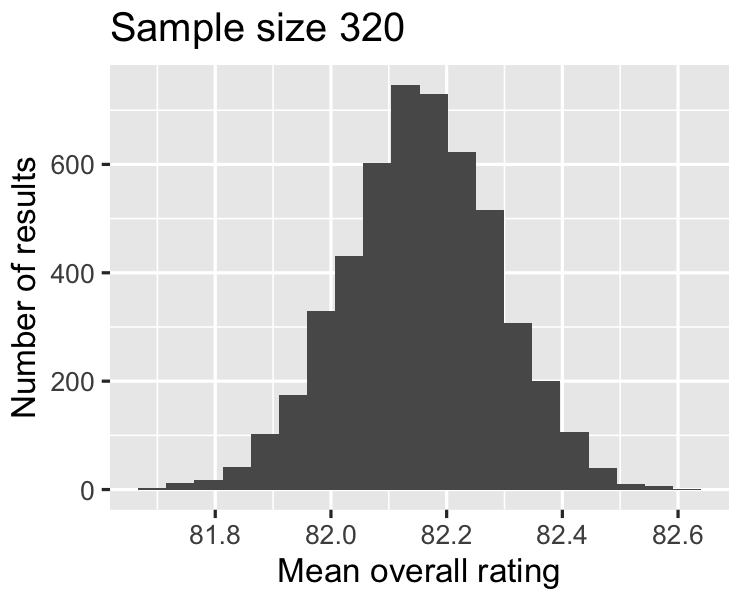
随着样本量增大,
均值分布更接近正态,且
抽样分布更窄。
coffee_ratings %>%
  summarize(
    mean_cup_points = mean(total_cup_points)
  ) %>%
  pull(mean_cup_points)
82.1512
82.1496
82.1610
82.1521
coffee_ratings %>%
  summarize(
    sd_cup_points = sd(total_cup_points)
  ) %>%
  pull(sd_cup_points)
2.68686
1.1929
0.6028
0.2865
0.1304
2.68686 / sqrt(5)
1.2016
2.68686 / sqrt(20)
0.6008
2.68686 / sqrt(80)
0.3004
2.68686 / sqrt(320)
0.1502