简单线性回归

Python 中的时间序列分析

Rob Reider

Adjunct Professor, NYU-Courant Consultant, Quantopian

什么是回归?

  • 简单线性回归:

$\ \ \ \ y_t = \alpha + \beta x_t + \epsilon_t$

Python 中的时间序列分析

什么是回归?

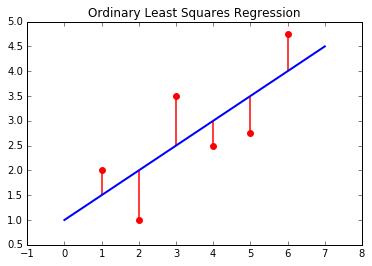
  • 普通最小二乘(OLS)
Python 中的时间序列分析

用于回归的 Python 包

  • 在 statsmodels 中:
    import statsmodels.api as sm
    sm.OLS(y, x).fit()
    
  • 在 numpy 中:
    np.polyfit(x, y, deg=1)
    
  • 在 pandas 中:
    pd.ols(y, x)
    
  • 在 scipy 中:
    from scipy import stats
    stats.linregress(x, y)
    

注意:各包中 xy 的顺序不一致

Python 中的时间序列分析

示例:小盘收益对大盘的回归

  • 导入 statsmodels 模块
    import statsmodels.api as sm
    
  • 与前面相同,计算两列的百分比变化
    df['SPX_Ret'] = df['SPX_Prices'].pct_change()
    df['R2000_Ret'] = df['R2000_Prices'].pct_change()
    
  • 为回归截距向 DataFrame 添加常数项
    df = sm.add_constant(df)
    
Python 中的时间序列分析

回归示例(续)

  • 注意第一行收益为 NaN
                SPX_Price  R2000_Price   SPX_Ret  R2000_Ret
    Date                                                     
    2012-11-01  1427.589966   827.849976       NaN        NaN
    2012-11-02  1414.199951   814.369995 -0.009379  -0.016283
    
  • 删除含 NaN 的行
      df = df.dropna()
    
  • 运行回归
      results = sm.OLS(df['R2000_Ret'],df[['const','SPX_Ret']]).fit()
      print(results.summary())
    
Python 中的时间序列分析

回归示例(续)

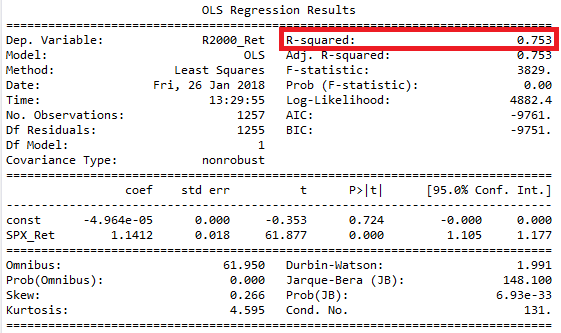
  • 回归输出

  • 截距在 results.params[0]
  • 斜率在 results.params[1]
Python 中的时间序列分析

回归示例(续)

  • 回归输出

Python 中的时间序列分析

R² 与相关性的关系

  • $ [\text{corr} (x,y)]^2 = R^2$(R 平方)
  • $ \text{sign(corr)} = \text{sign(regression slope)}$
  • 上例中:
    • R² = 0.753
    • 斜率为正
    • 相关系数 = $ + \sqrt{0.753} = 0.868$
Python 中的时间序列分析

Passons à la pratique !

Python 中的时间序列分析

Preparing Video For Download...