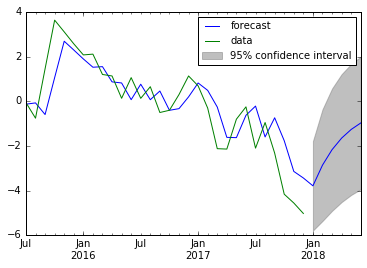
估计与预测 AR 模型
Python 中的时间序列分析

Rob Reider
Adjunct Professor, NYU-Courant Consultant, Quantopian
估计 AR 模型
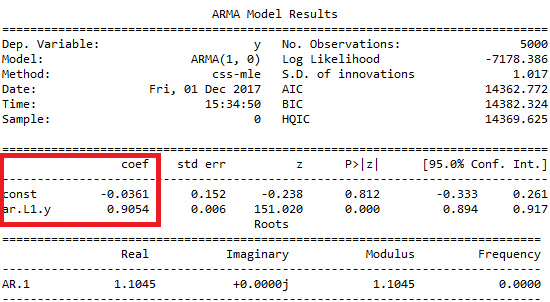
- 完整输出(真实值 $\large \mu=0$,$\large \phi=0.9$)
print(result.summary())
用 AR 模型进行预测
from statsmodels.graphics.tsaplots import plot_predict
fig, ax = plt.subplots()
data.plot(ax=ax)
plot_predict(result, start='2012-09-27', end='2012-10-06', alpha=0.05, ax=ax)
plt.show()
- 函数
plot_predict()的参数- 第一个参数为已拟合模型
- 将
alpha=None可去除置信区间 - 设
ax=ax可在同一坐标轴上绘制数据与预测