指数加权预测

R 中的预测

Rob J. Hyndman

Professor of Statistics at Monash University

简单指数平滑

预测记号: $\hat y_{t + h \vert t} = \text{点预测 }\ \hat y_{t + h} \ \text{在已知数据 }\ y_1,...,y_t\ \text{下}$

预测方程: $\hat y_{t + h \vert t} = \alpha y_t + \alpha (1-\alpha ) y_{t-1} + \alpha (1-\alpha )^2 y_{t-2} +...$

$$其中\ 0 \leq \alpha \leq 1 $$

R 中的预测

简单指数平滑

观测值 $\alpha$ = 0.2 $\alpha$ = 0.4 $\alpha$ = 0.6 $\alpha$ = 0.8
$y_t$ 0.2 0.4 0.6 0.8
$y_{t-1}$ 0.16 0.24 0.24 0.16
$y_{t-2}$ 0.128 0.144 0.096 0.032
$y_{t-3}$ 0.1024 0.0864 0.0384 0.0064
$y_{t-4}$ (0.2)(0.8)$^4$ (0.4)(0.6)$^4$ (0.6)(0.4)$^4$ (0.8)(0.2)$^4$
$y_{t-5}$ (0.2)(0.8)$^5$ (0.4)(0.6)$^5$ (0.6)(0.4)$^5$ (0.8)(0.2)$^5$
R 中的预测

简单指数平滑


组成形式
预测方程 $\hat{y}_{t+h \mid t} = \ell_t$
平滑方程 $\ell_t = \alpha y_t + (1-\alpha)\ell_{t-1}$


  • $\ell_t\ $ 为时点 $t$ 的水平(平滑值)
  • 通过最小化 SSE 选择 $\alpha$ 与 $\ell_0$:

$$SSE = \sum_{t=1}^T (y_t - \hat y_{t\vert t-1})^2$$

R 中的预测

示例:石油产量

oildata <- window(oil, start = 1996)    # 石油数据
fc <- ses(oildata, h = 5)               # 简单指数平滑
summary(fc)
Forecast method: Simple exponential smoothing
Model Information:
Simple exponential smoothing
Call:
 ses(y = oildata, h = 5)
  Smoothing parameters:
    alpha = 0.8339
  Initial states:
    l = 446.5759
  sigma:  28.12
*** Truncated due to space
R 中的预测

示例:石油产量

autoplot(fc) +
  ylab("Oil (millions of tonnes)") + xlab("Year")
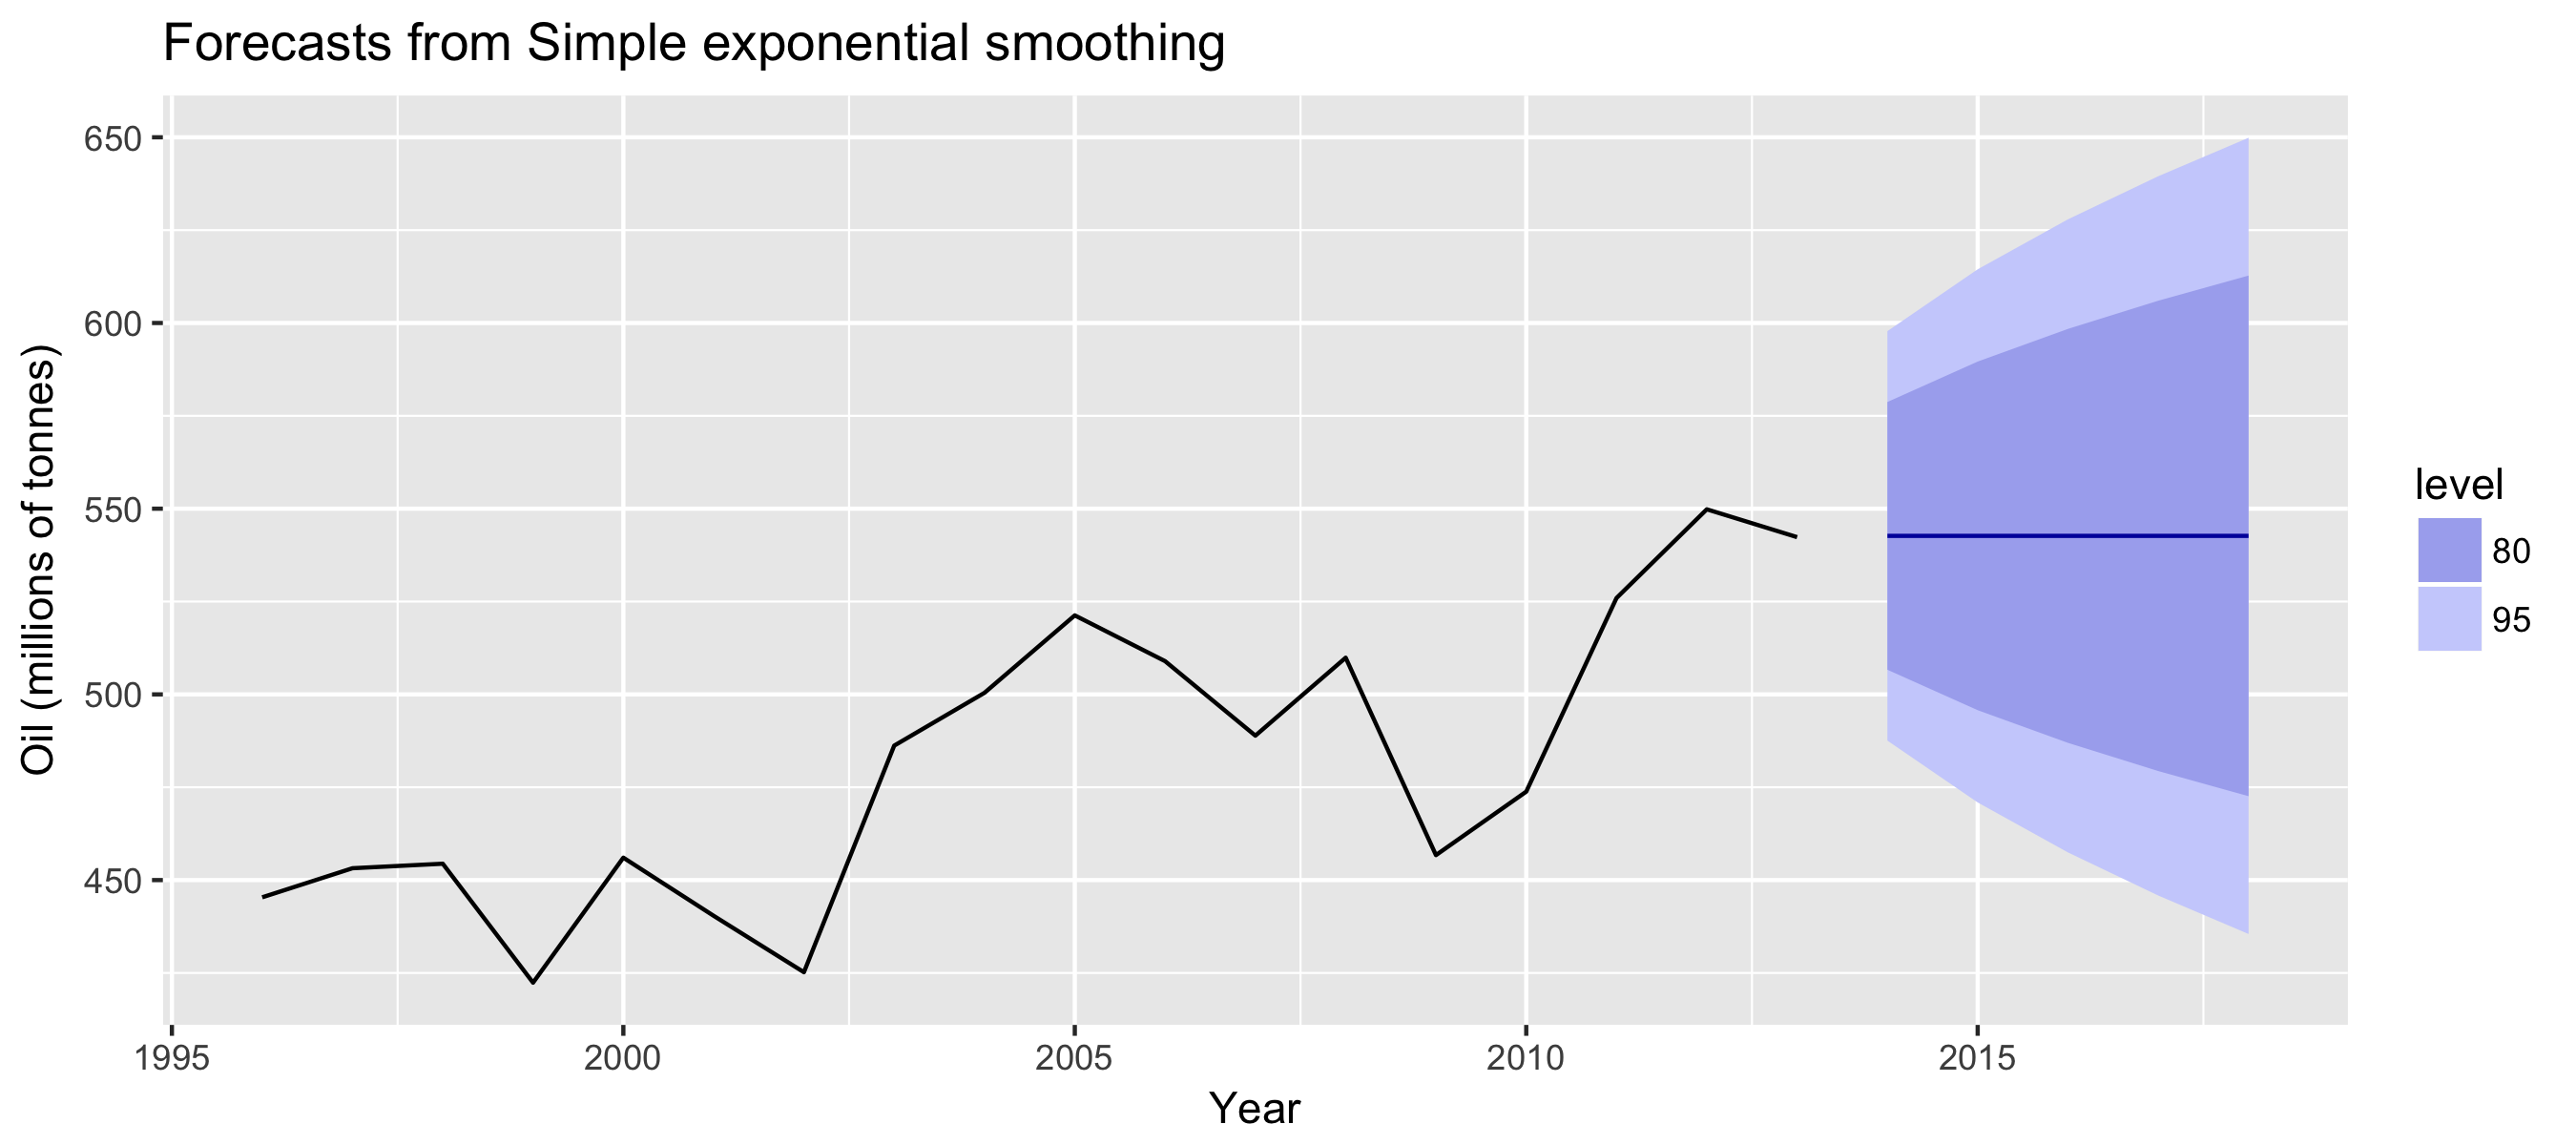
第3章视频1_石油_简单指数平滑.png

R 中的预测

让我们来练习!

R 中的预测

Preparing Video For Download...