使用 LIME 进行局部可解释性

Python 可解释性 AI

Fouad Trad

Machine Learning Engineer

  • LIME → 局部可解释、与模型无关的解释
  • 解释复杂模型的预测
  • 作用于单个样本
  • 与模型类型无关

LIME 标志。

Python 可解释性 AI

LIME 解释器

  • 适配不同类型的数据

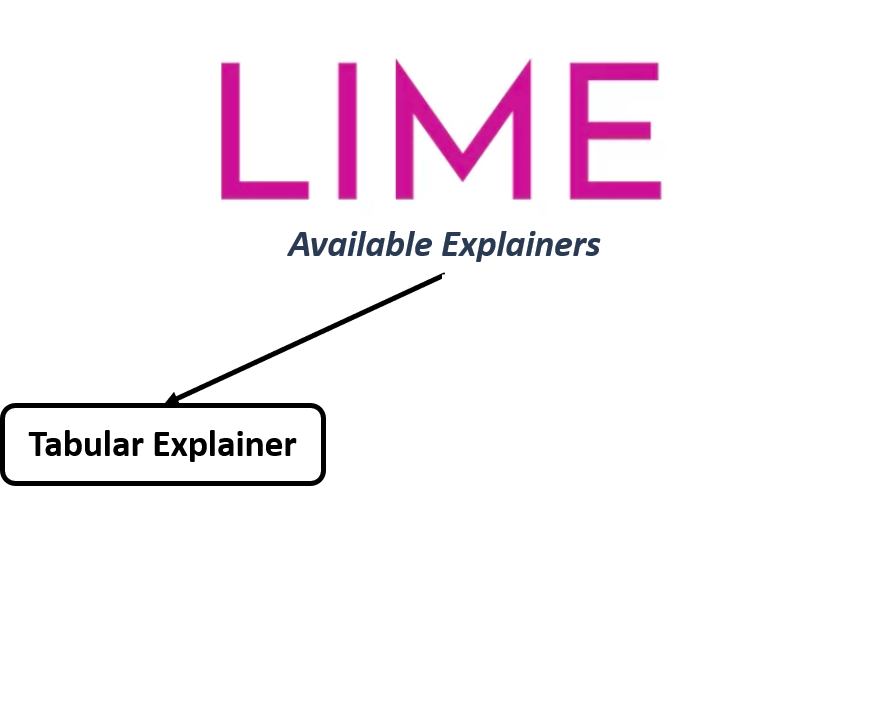
图示显示可用的 LIME 解释器。第一个是表格解释器。

Python 可解释性 AI

LIME 解释器

  • 适配不同类型的数据

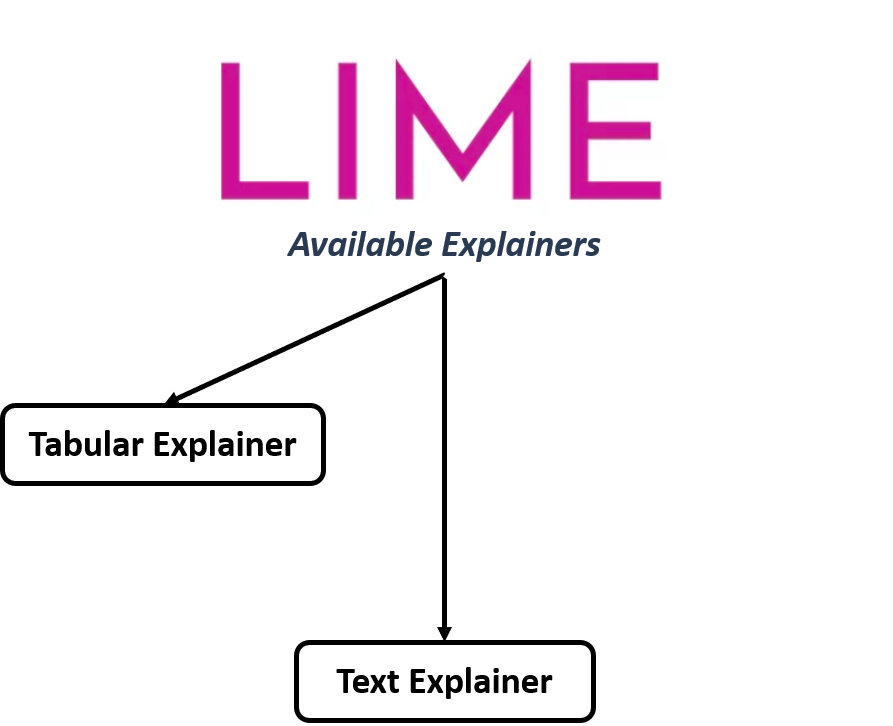
同一图示,另高亮文本解释器。

Python 可解释性 AI

LIME 解释器

  • 适配不同类型的数据
  • 围绕样本生成扰动
  • 观察对模型输出的影响
  • 构建更简单的解释模型

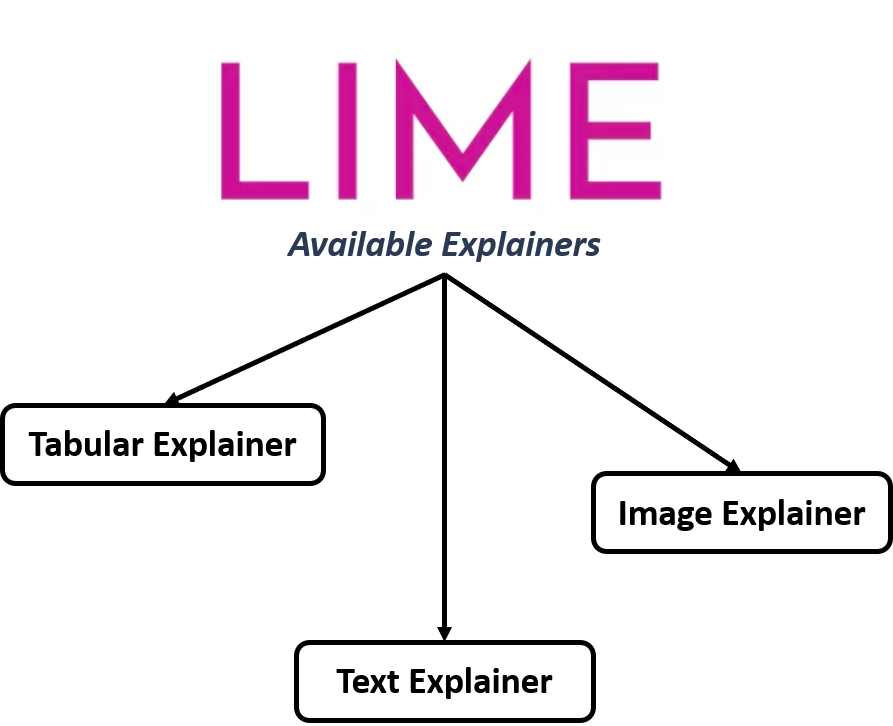
同一图示,另高亮图像解释器。

Python 可解释性 AI

LIME 解释器

  • 适配不同类型的数据
  • 围绕样本生成扰动
  • 观察对模型输出的影响
  • 构建更简单的解释模型

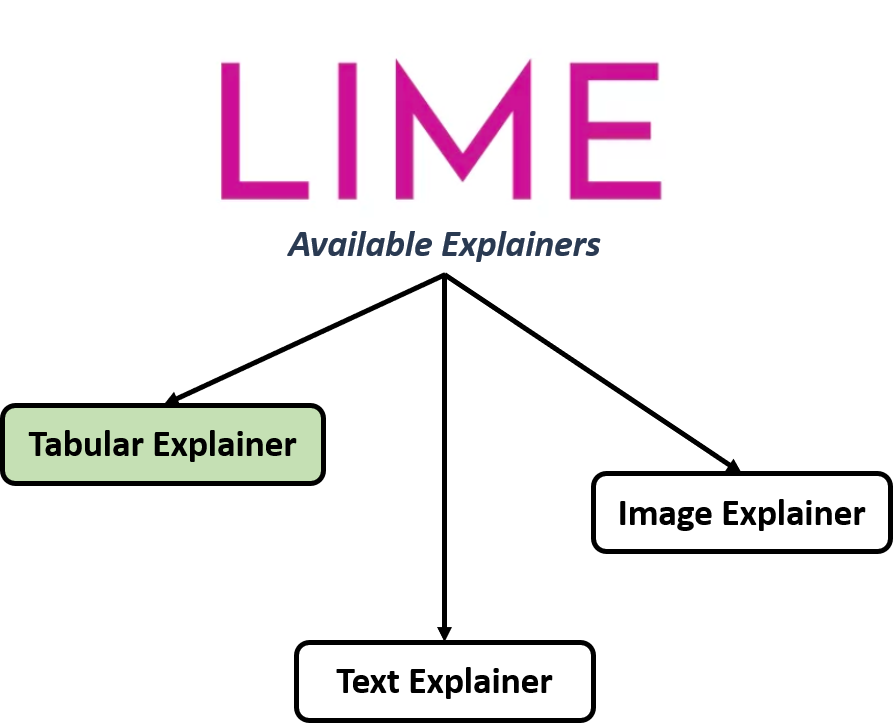
同一图示,高亮表格解释器。

Python 可解释性 AI

录取数据集

GRE 分数 TOEFL 分数 学校评级 SOP LOR CGPA 录取概率 是否录取
337 118 4 4.5 4.5 9.65 0.92 1
324 107 4 4 4.5 8.87 0.76 1
316 104 3 3 3.5 8 0.72 1
322 110 3 3.5 2.5 8.67 0.8 1
314 103 2 2 3 8.21 0.45 0


  • regressor:预测录取概率
  • classifier:预测是否录取
  • 特征在 X
Python 可解释性 AI

创建表格解释器

回归
from lime.lime_tabular import LimeTabularExplainer

instance = X.iloc[1,:]
explainer_reg = LimeTabularExplainer( X.values,
feature_names=X.columns,
mode='regression'
)
explanation_reg = explainer_reg.explain_instance(
instance.values,
regressor.predict
)
分类
from lime.lime_tabular import LimeTabularExplainer

instance = X.iloc[1,:]
explainer_class = LimeTabularExplainer( X.values,
feature_names=X.columns,
mode='classification'
)
explanation_class = explainer_class.explain_instance(
instance.values,
classifier.predict_proba
)
Python 可解释性 AI

可视化解释

回归
explanation_reg.as_pyplot_figure()
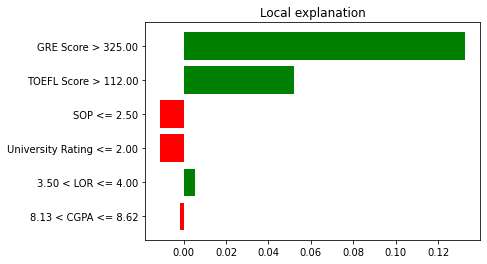
条形图显示各特征对回归模型的影响。特征置于区间内以便于解释。

分类
explanation_class.as_pyplot_figure()
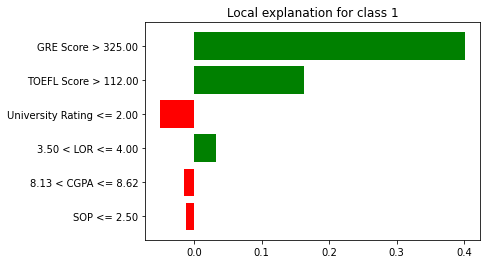
条形图显示各特征对分类模型的影响。特征置于区间内以便于解释。

Python 可解释性 AI

SHAP vs. LIME

SHAP
shap.waterfall_plot(...)
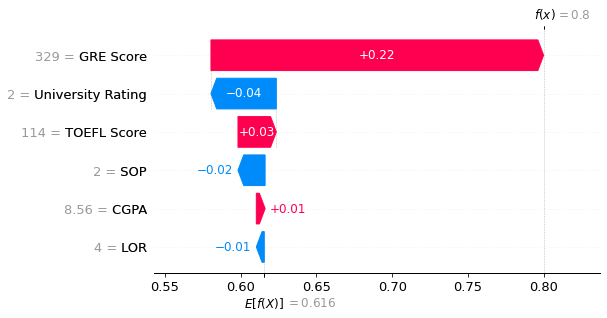
SHAP 瀑布图展示每个特征如何正向或负向推动预测。

LIME
explanation_class.as_pyplot_figure()

条形图显示各特征对分类模型的影响。特征置于区间内以便于解释。

Python 可解释性 AI

开始练习!

Python 可解释性 AI

Preparing Video For Download...