更多模型度量

R 中的树模型机器学习

Sandro Raabe

Data Scientist

准确率的局限


  • "朴素"模型始终预测 no 也可达 98% 准确率

→ 在负类占 98% 的不平衡数据集中可能出现

R 中的树模型机器学习

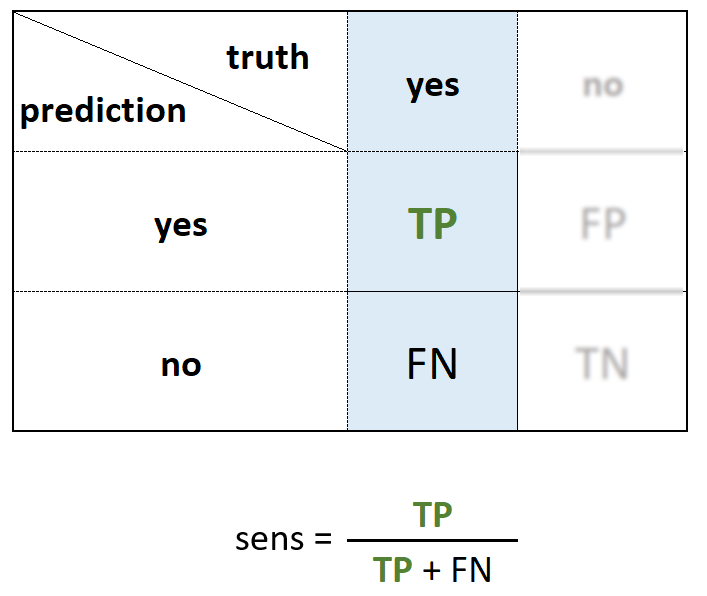
灵敏度(真正率)

  • 所有正类中被正确分类的比例

显示灵敏度的混淆矩阵

R 中的树模型机器学习

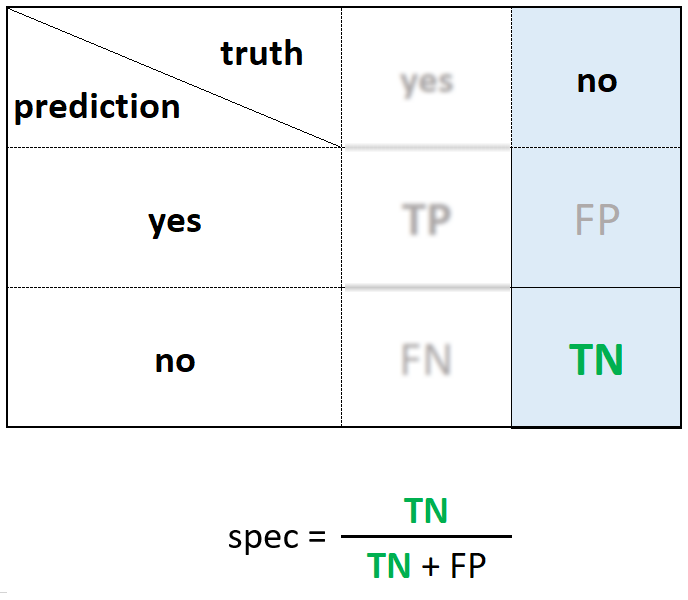
特异度(真负率)

  • 所有负类中被正确分类的比例

显示真负率的混淆矩阵

R 中的树模型机器学习

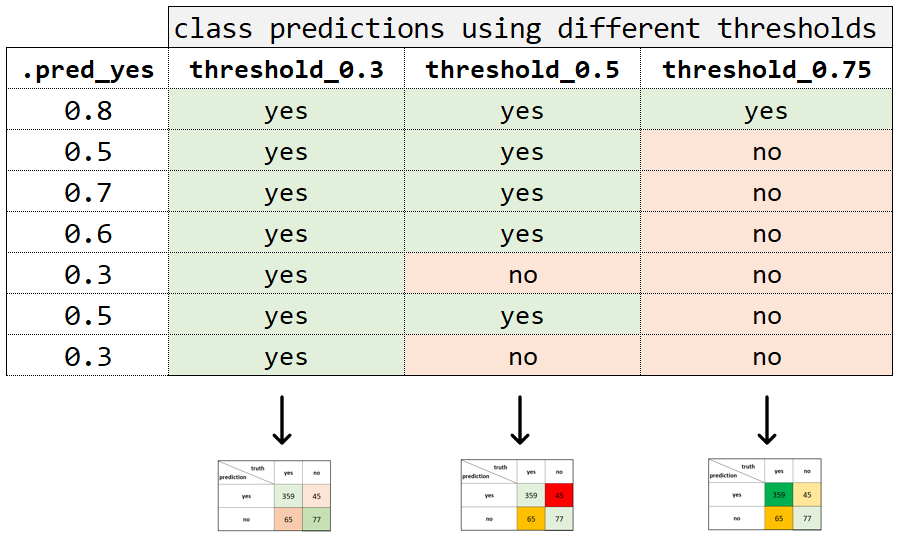
展示不同阈值的表格

R 中的树模型机器学习

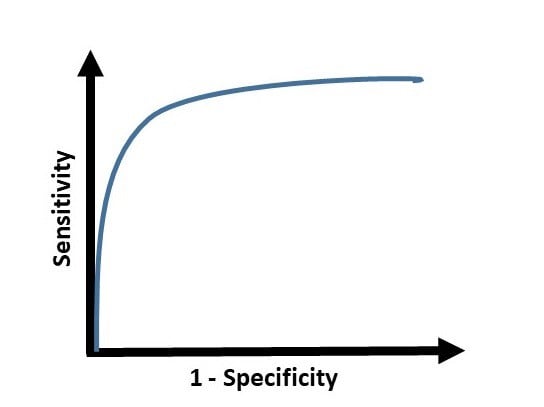
ROC(受试者工作特征)曲线

  • 可视化分类模型在所有阈值下的表现

ROC 曲线图

R 中的树模型机器学习

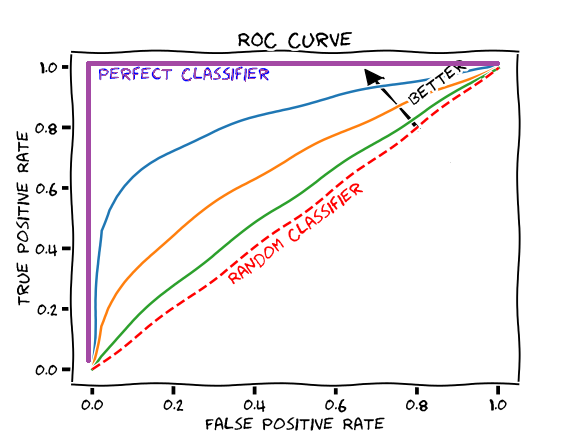
ROC 曲线与 AUC

不同的 ROC 曲线

R 中的树模型机器学习

ROC 曲线下的面积(AUC)

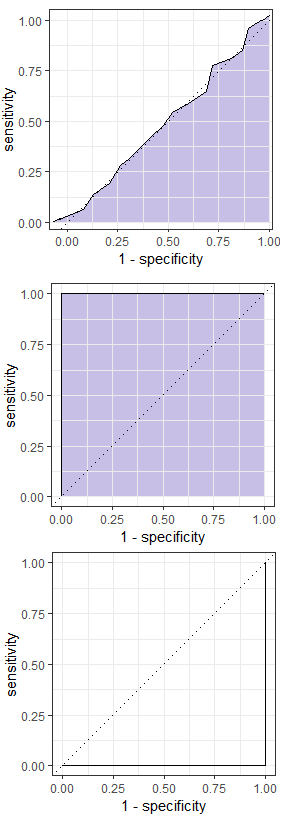
AUC 图

  • AUC = 0.5
  • 表现不优于随机


  • AUC = 1
  • 任一阈值下均完全正确 → 完美模型


  • AUC = 0
  • 全部样本均被错误分类
R 中的树模型机器学习

yardstick 灵敏度:sens()

predictions
# A tibble: 153 x 2
.pred_class   true_class
      <fct>        <fct>     
 1      yes           no        
 2       no           no        
 3       no          yes       
 4      yes          yes
# Calculate single-threshold sensitivity
sens(predictions, 
     estimate = .pred_class, 
     truth = true_class)
# A tibble: 1 x 2
  .metric        .estimate
  <chr>              <dbl>
1 sensitivity        0.872
  • accuracy()conf_mat() 参数类似
R 中的树模型机器学习

yardstick ROC:roc_curve()

# Predict probabilities on test set
predictions <- predict(model,
                       data_test,

type = "prob") %>%
bind_cols(data_test)
# A tibble: 9,116 x 13
   .pred_yes still_customer age gender    ...
       <dbl> <fct>         <int> <fct>    ...
 1    0.0557 no               45 M        ...
 2    0.0625 no               49 F        ...
 3    0.330  no               51 M        ...
 4    ...
 ...
# Calculate the ROC curve for all thresholds
roc <- roc_curve(predictions,

estimate = .pred_yes,
truth = still_customer)
# Plot the ROC curve autoplot(roc)

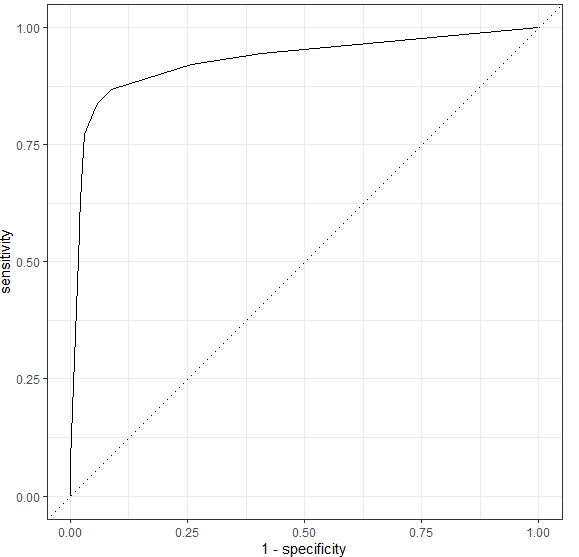
ROC 曲线

R 中的树模型机器学习

yardstick AUC:roc_auc()

  • 相同参数:数据、预测列、真实列
# Calculate area under curve
roc_auc(predictions, 
        estimate = .pred_yes, 
        truth = still_customer)
# A tibble: 1 x 3
  .metric .estimator .estimate
  <chr>   <chr>          <dbl>
1 roc_auc binary         0.872
R 中的树模型机器学习

让我们来度量!

R 中的树模型机器学习

Preparing Video For Download...