Tidyverse 的数据建模
Albert Y. Kim
Assistant Professor of Statistical and Data Sciences
$$
$$y = f(\vec{x}) + \epsilon$$
其中:
建模目的:
德克萨斯大学奥斯汀分校关于教学评价分数的研究(见 openintro.org)。
问题:能否基于教师属性解释教学评价分数的差异?
变量:
score
rank
gender
age
bty_avg
来自 moderndive 包(ModernDive.com):
moderndive
library(dplyr)
library(moderndive)
glimpse(evals)
Observations: 463
Variables: 13
$ ID           <int> 1, 2, 3, 4, 5, 6, 7, 8, 9, 10...
$ score        <dbl> 4.7, 4.1, 3.9, 4.8, 4.6, 4.3...
$ age          <int> 36, 36, 36, 36, 59, 59, 59, 51...
$ bty_avg      <dbl> 5.000, 5.000, 5.000, 5.000...
$ gender       <fct> female, female, female, female...
...
探索性数据分析(EDA)的三步:
library(ggplot2)
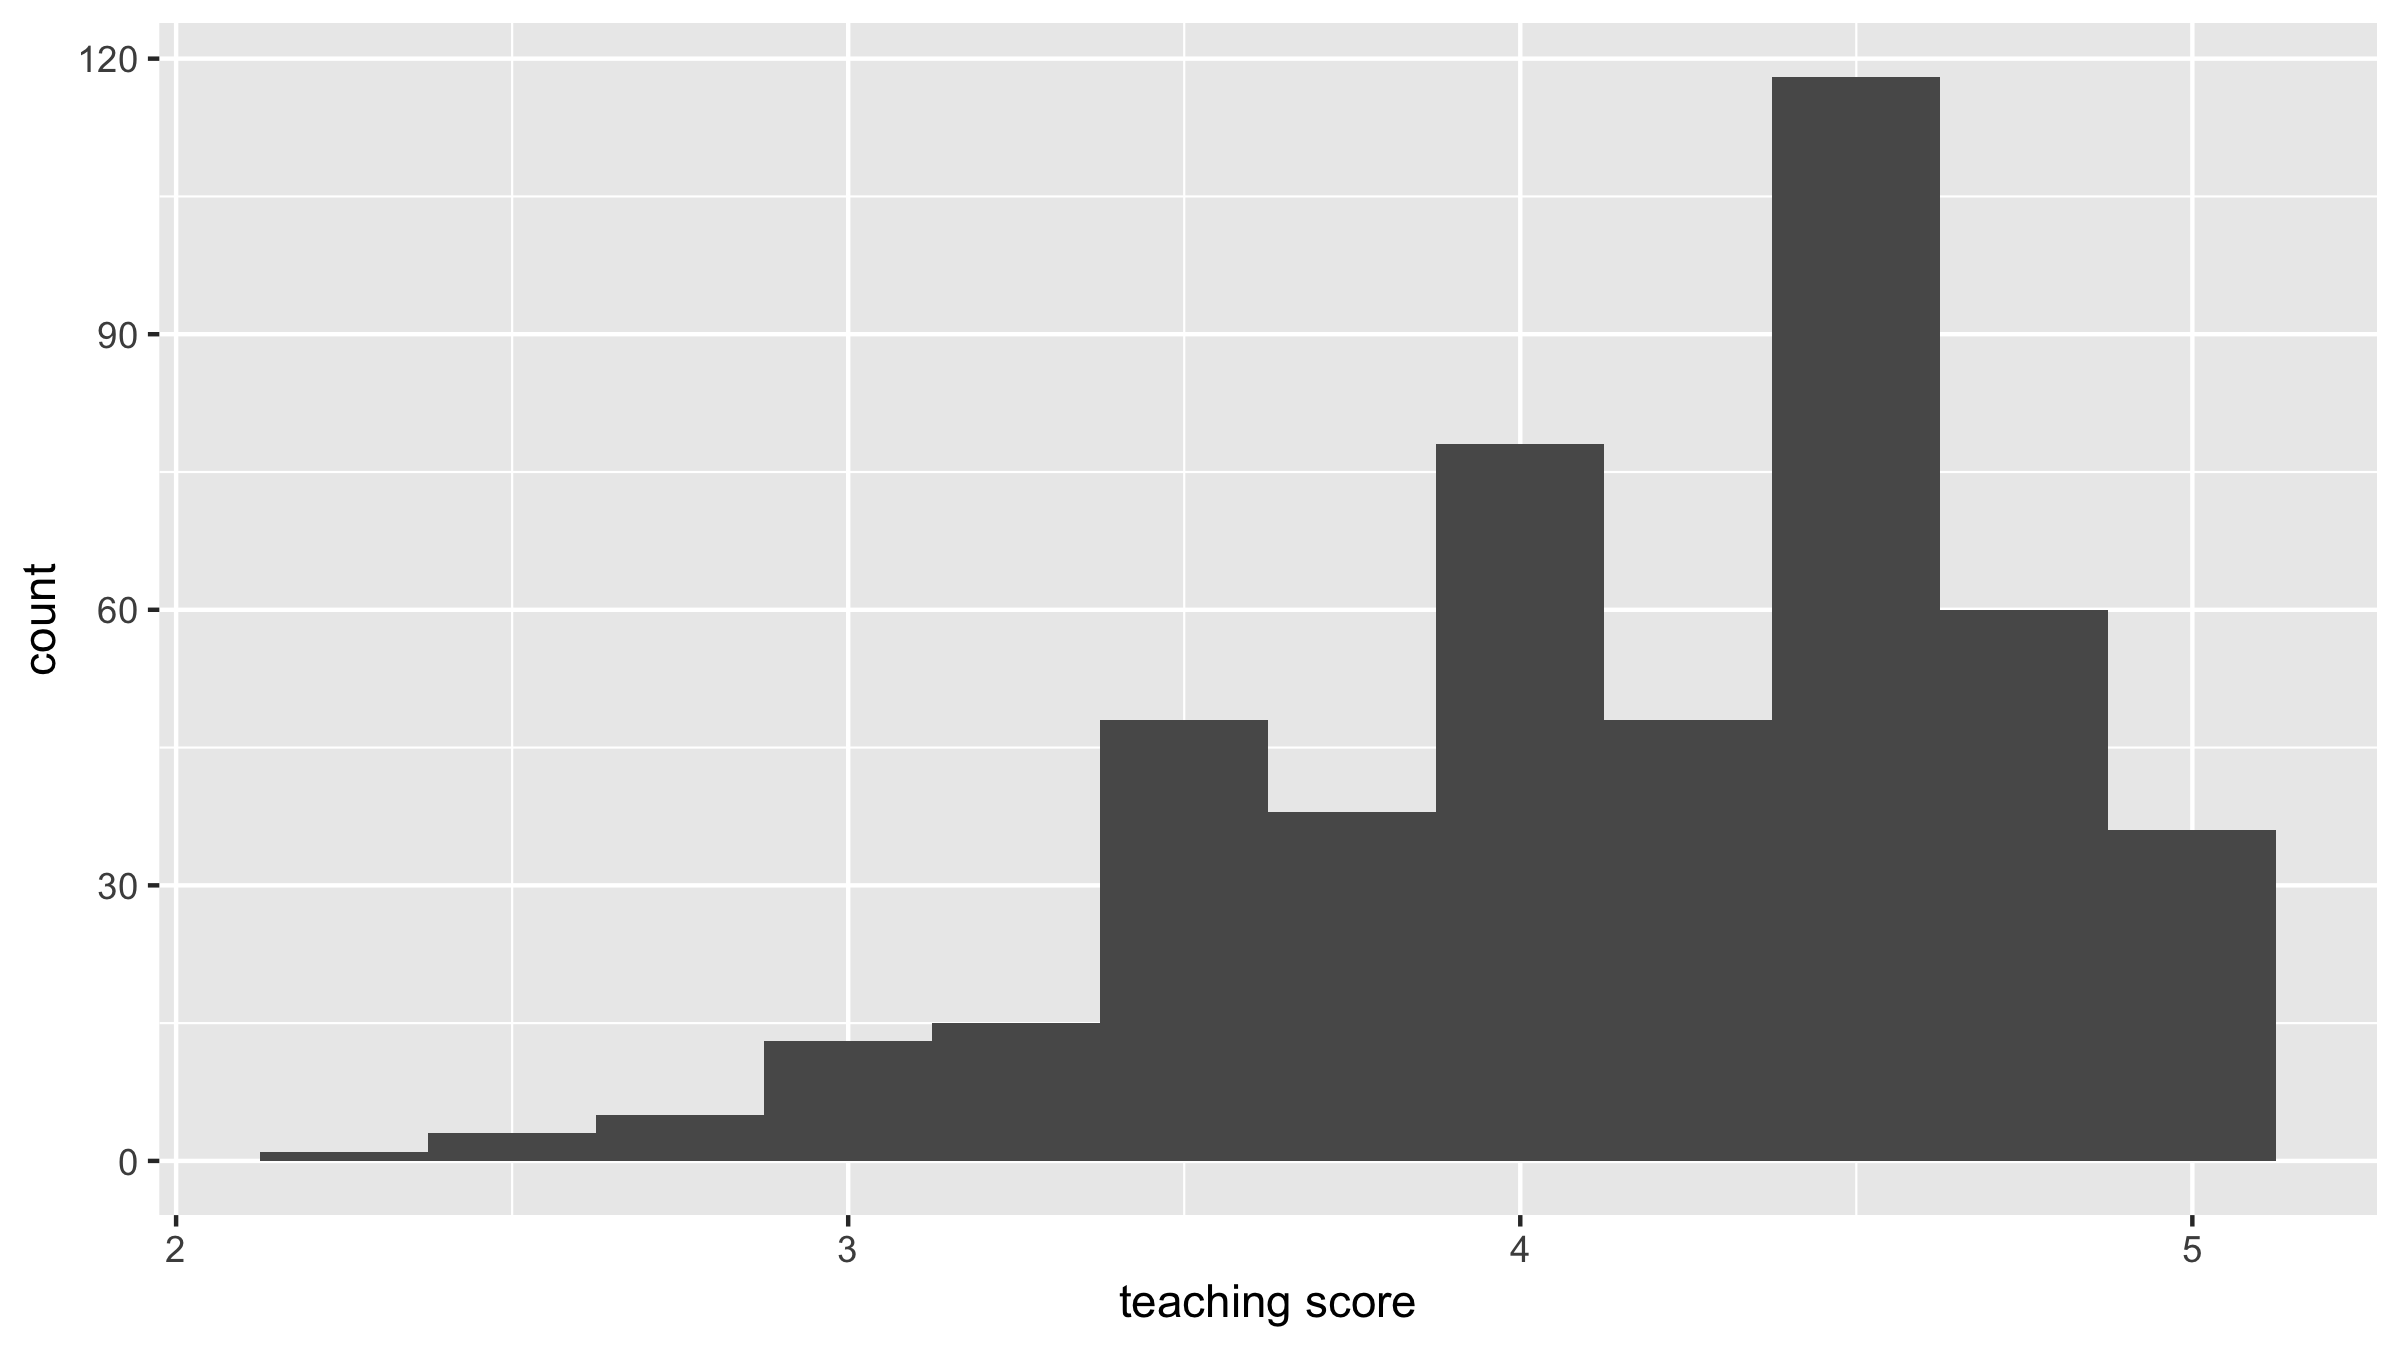
ggplot(evals, aes(x = score)) +
  geom_histogram(binwidth = 0.25) +
  labs(x = "teaching score", y = "count")
# Compute mean, median, and standard deviation
evals %>%
  summarize(mean_score = mean(score),
            median_score = median(score),
            sd_score = sd(score))
# A tibble: 1 x 3
  mean_score median_score sd_score
       <dbl>        <dbl>    <dbl>
1       4.17          4.3    0.544