Assistant Professor of Statistical and Data Sciences
回顾:通用建模框架公式
$$
y = f(\vec{x}) + \epsilon
$$
说明:
$y$:关注的结果变量
$\vec{x}$:解释/预测变量
$f()$:$y$ 与 $\vec{x}$ 关系的函数,即"信号"
$\epsilon$:非系统误差,即"噪声"
建模问题
考虑 $y = f(\vec{x}) + \epsilon$。
$f()$ 和 $\epsilon$ 未知
数据中给定了 $y$ 和 $\vec{x}$ 的 $n$ 个观测
目标:拟合模型 $\hat{f}()$,在忽略 $\epsilon$ 的同时近似 $f()$
目标重述:分离信号与噪声
进而生成拟合/预测值 $\hat{y} = \hat{f}(\vec{x})$
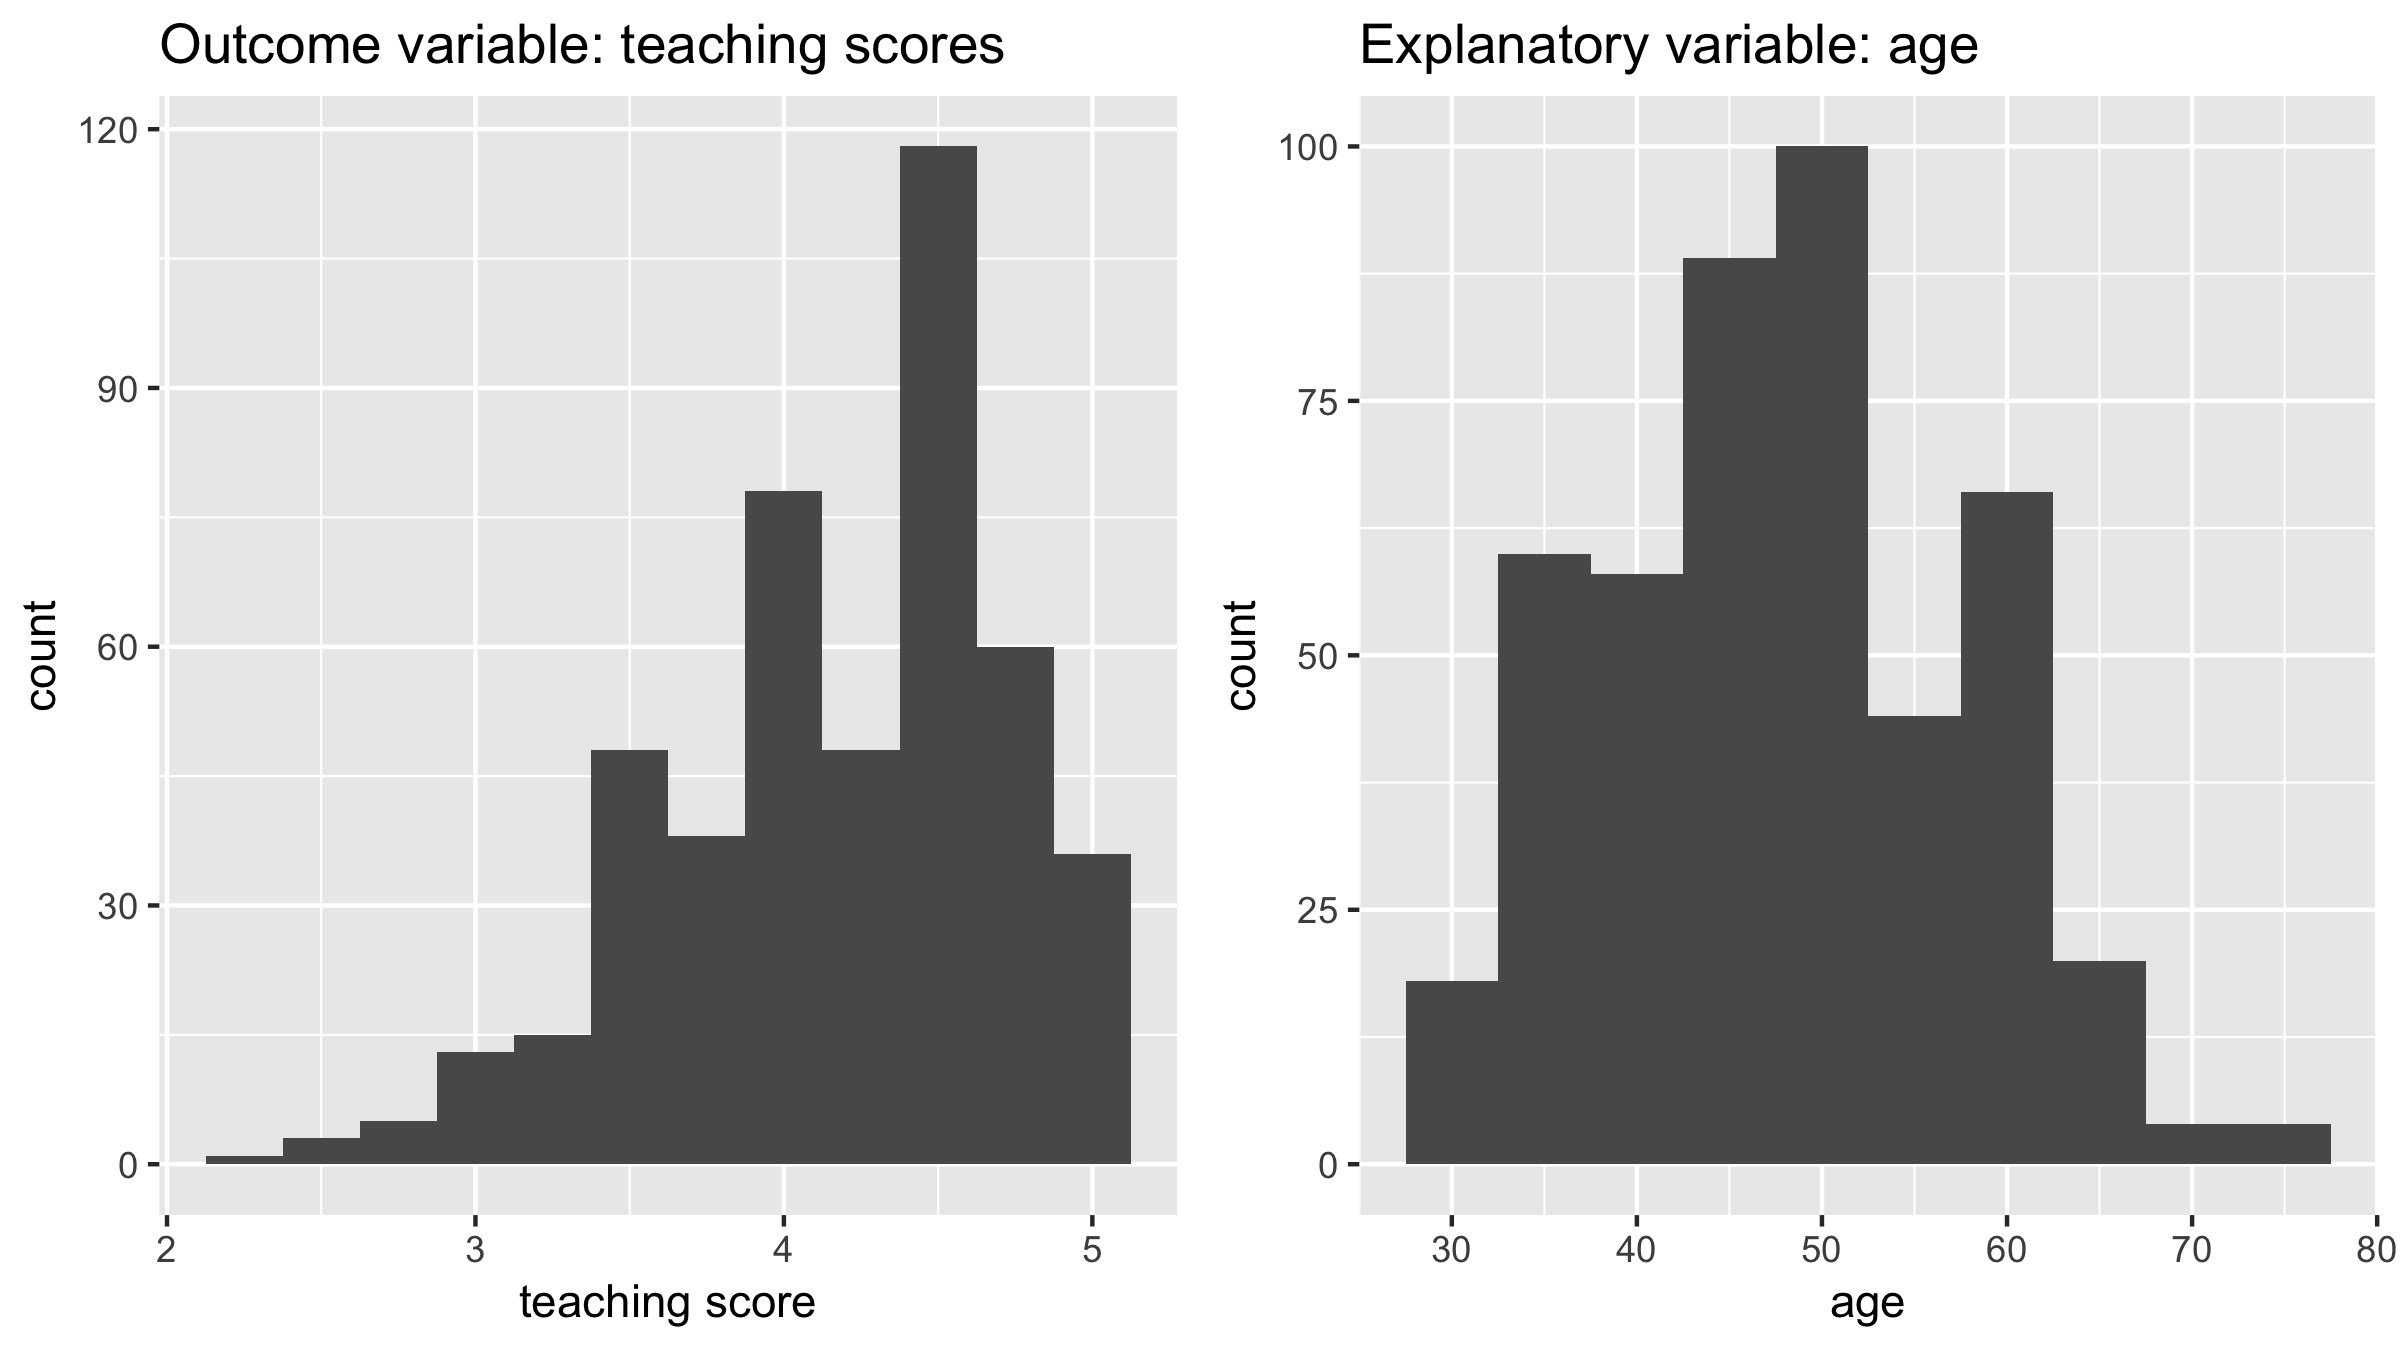
解释性建模示例
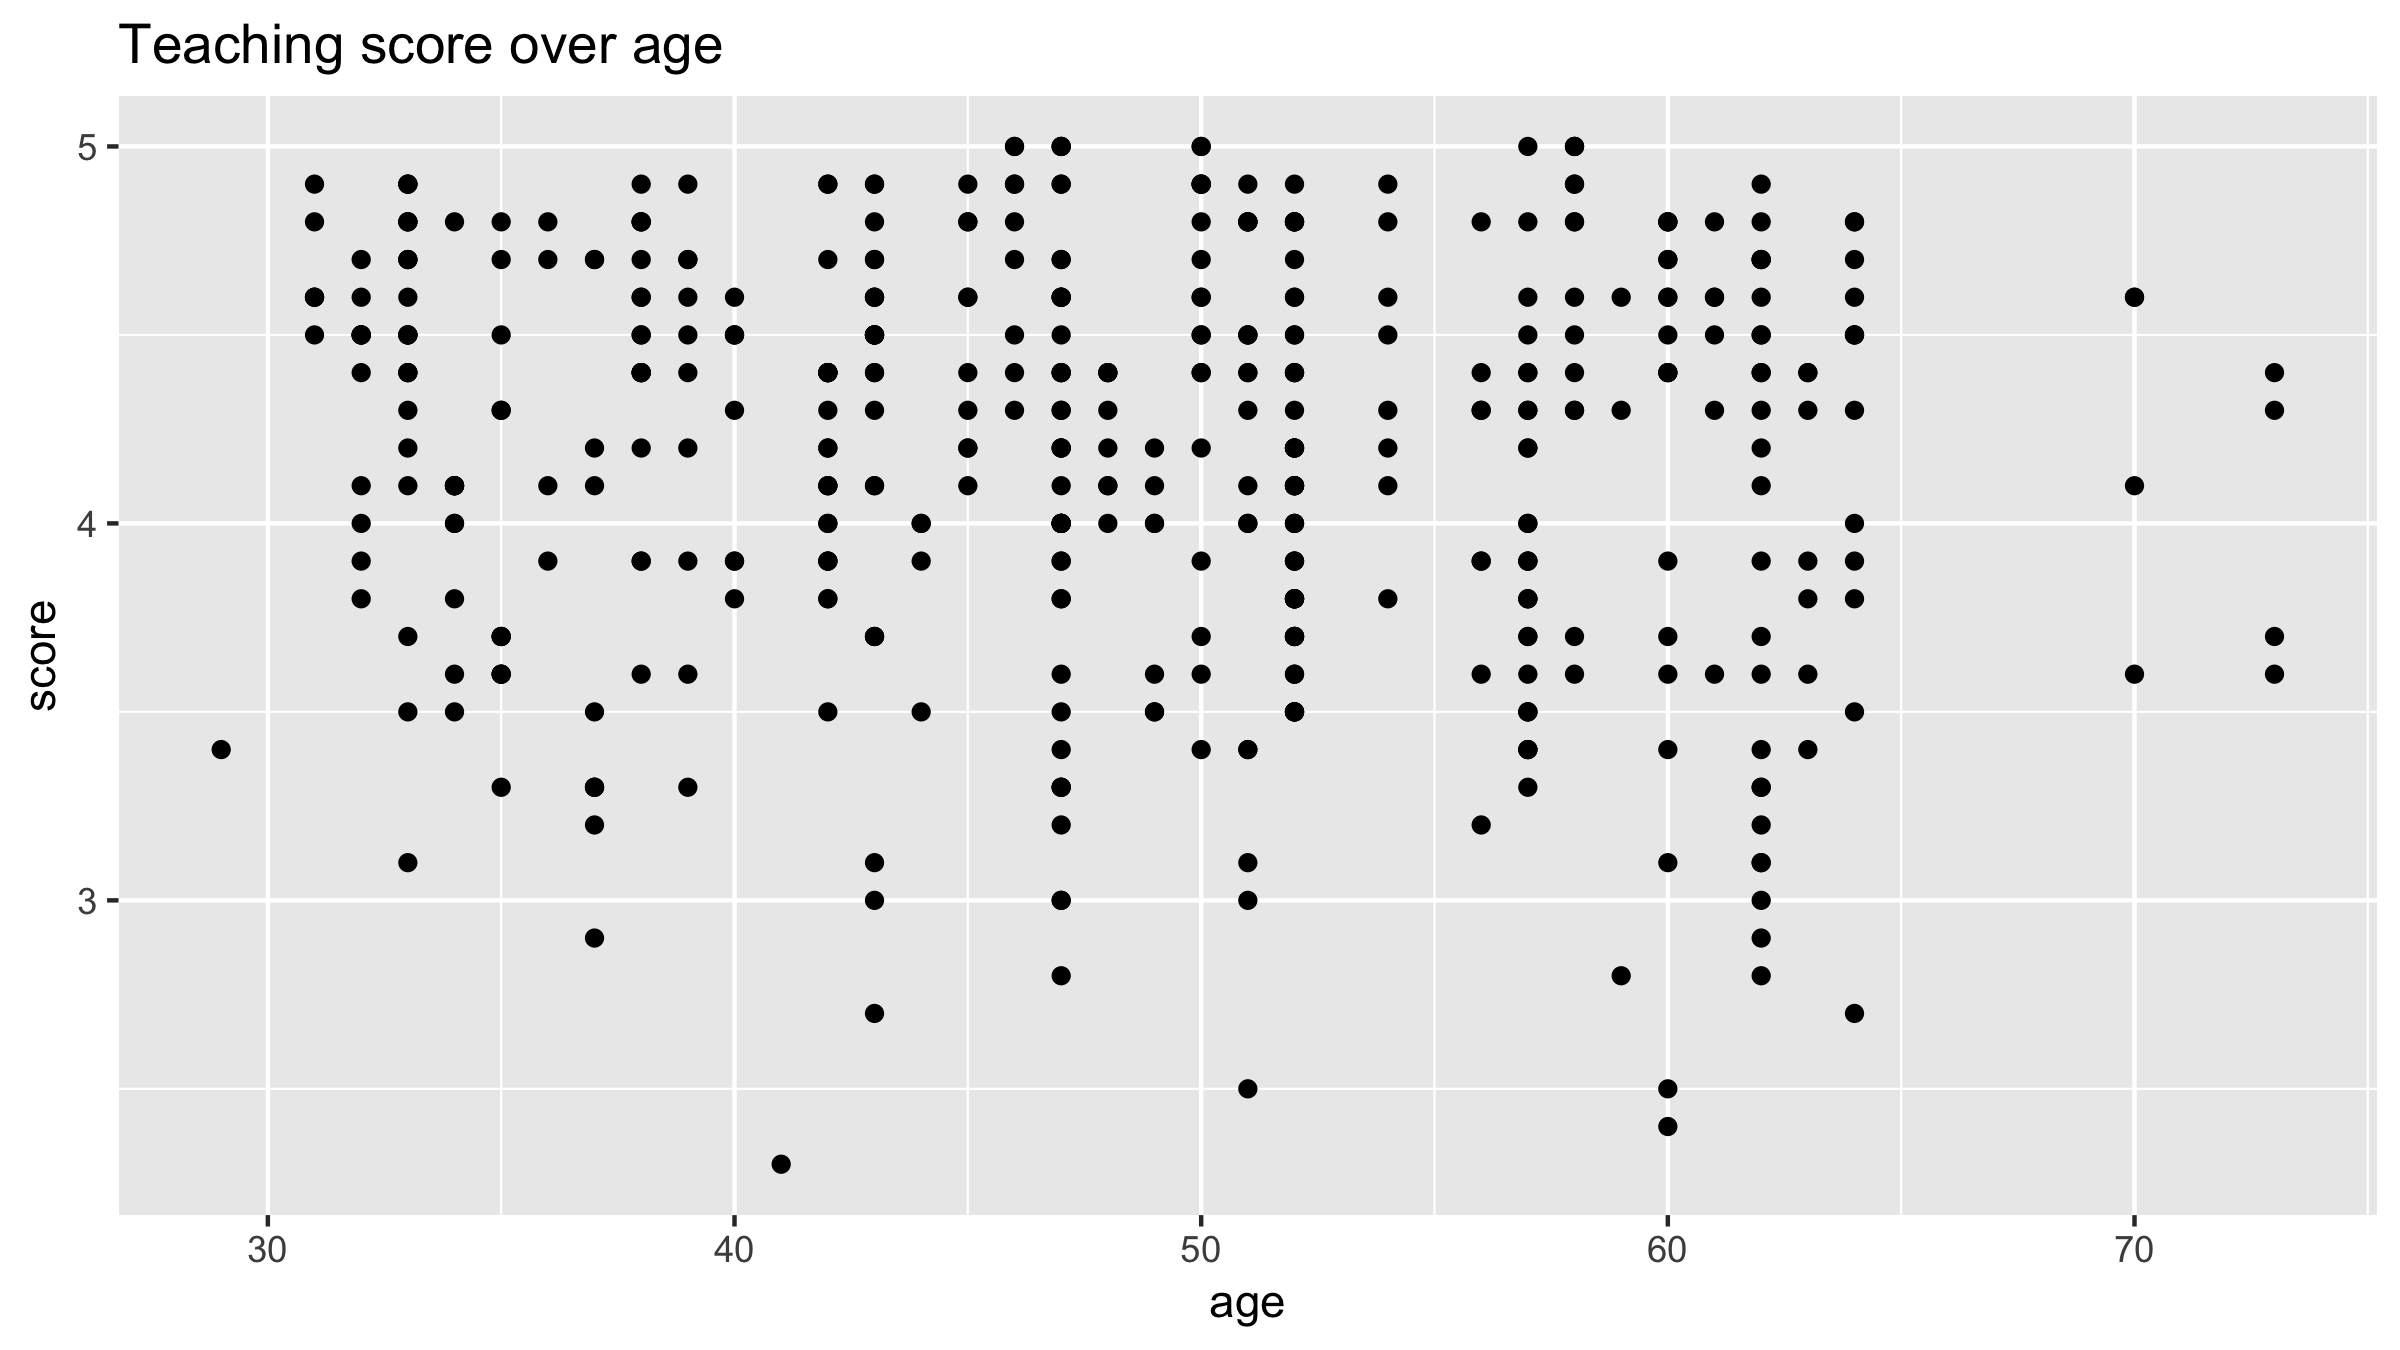
关系的 EDA
library(ggplot2)
library(dplyr)
library(moderndive)

ggplot(evals, aes(x = age, y = score)) +
  geom_point() +
  labs(x = "age", y = "score",
       title = "Teaching score over age")
关系的 EDA
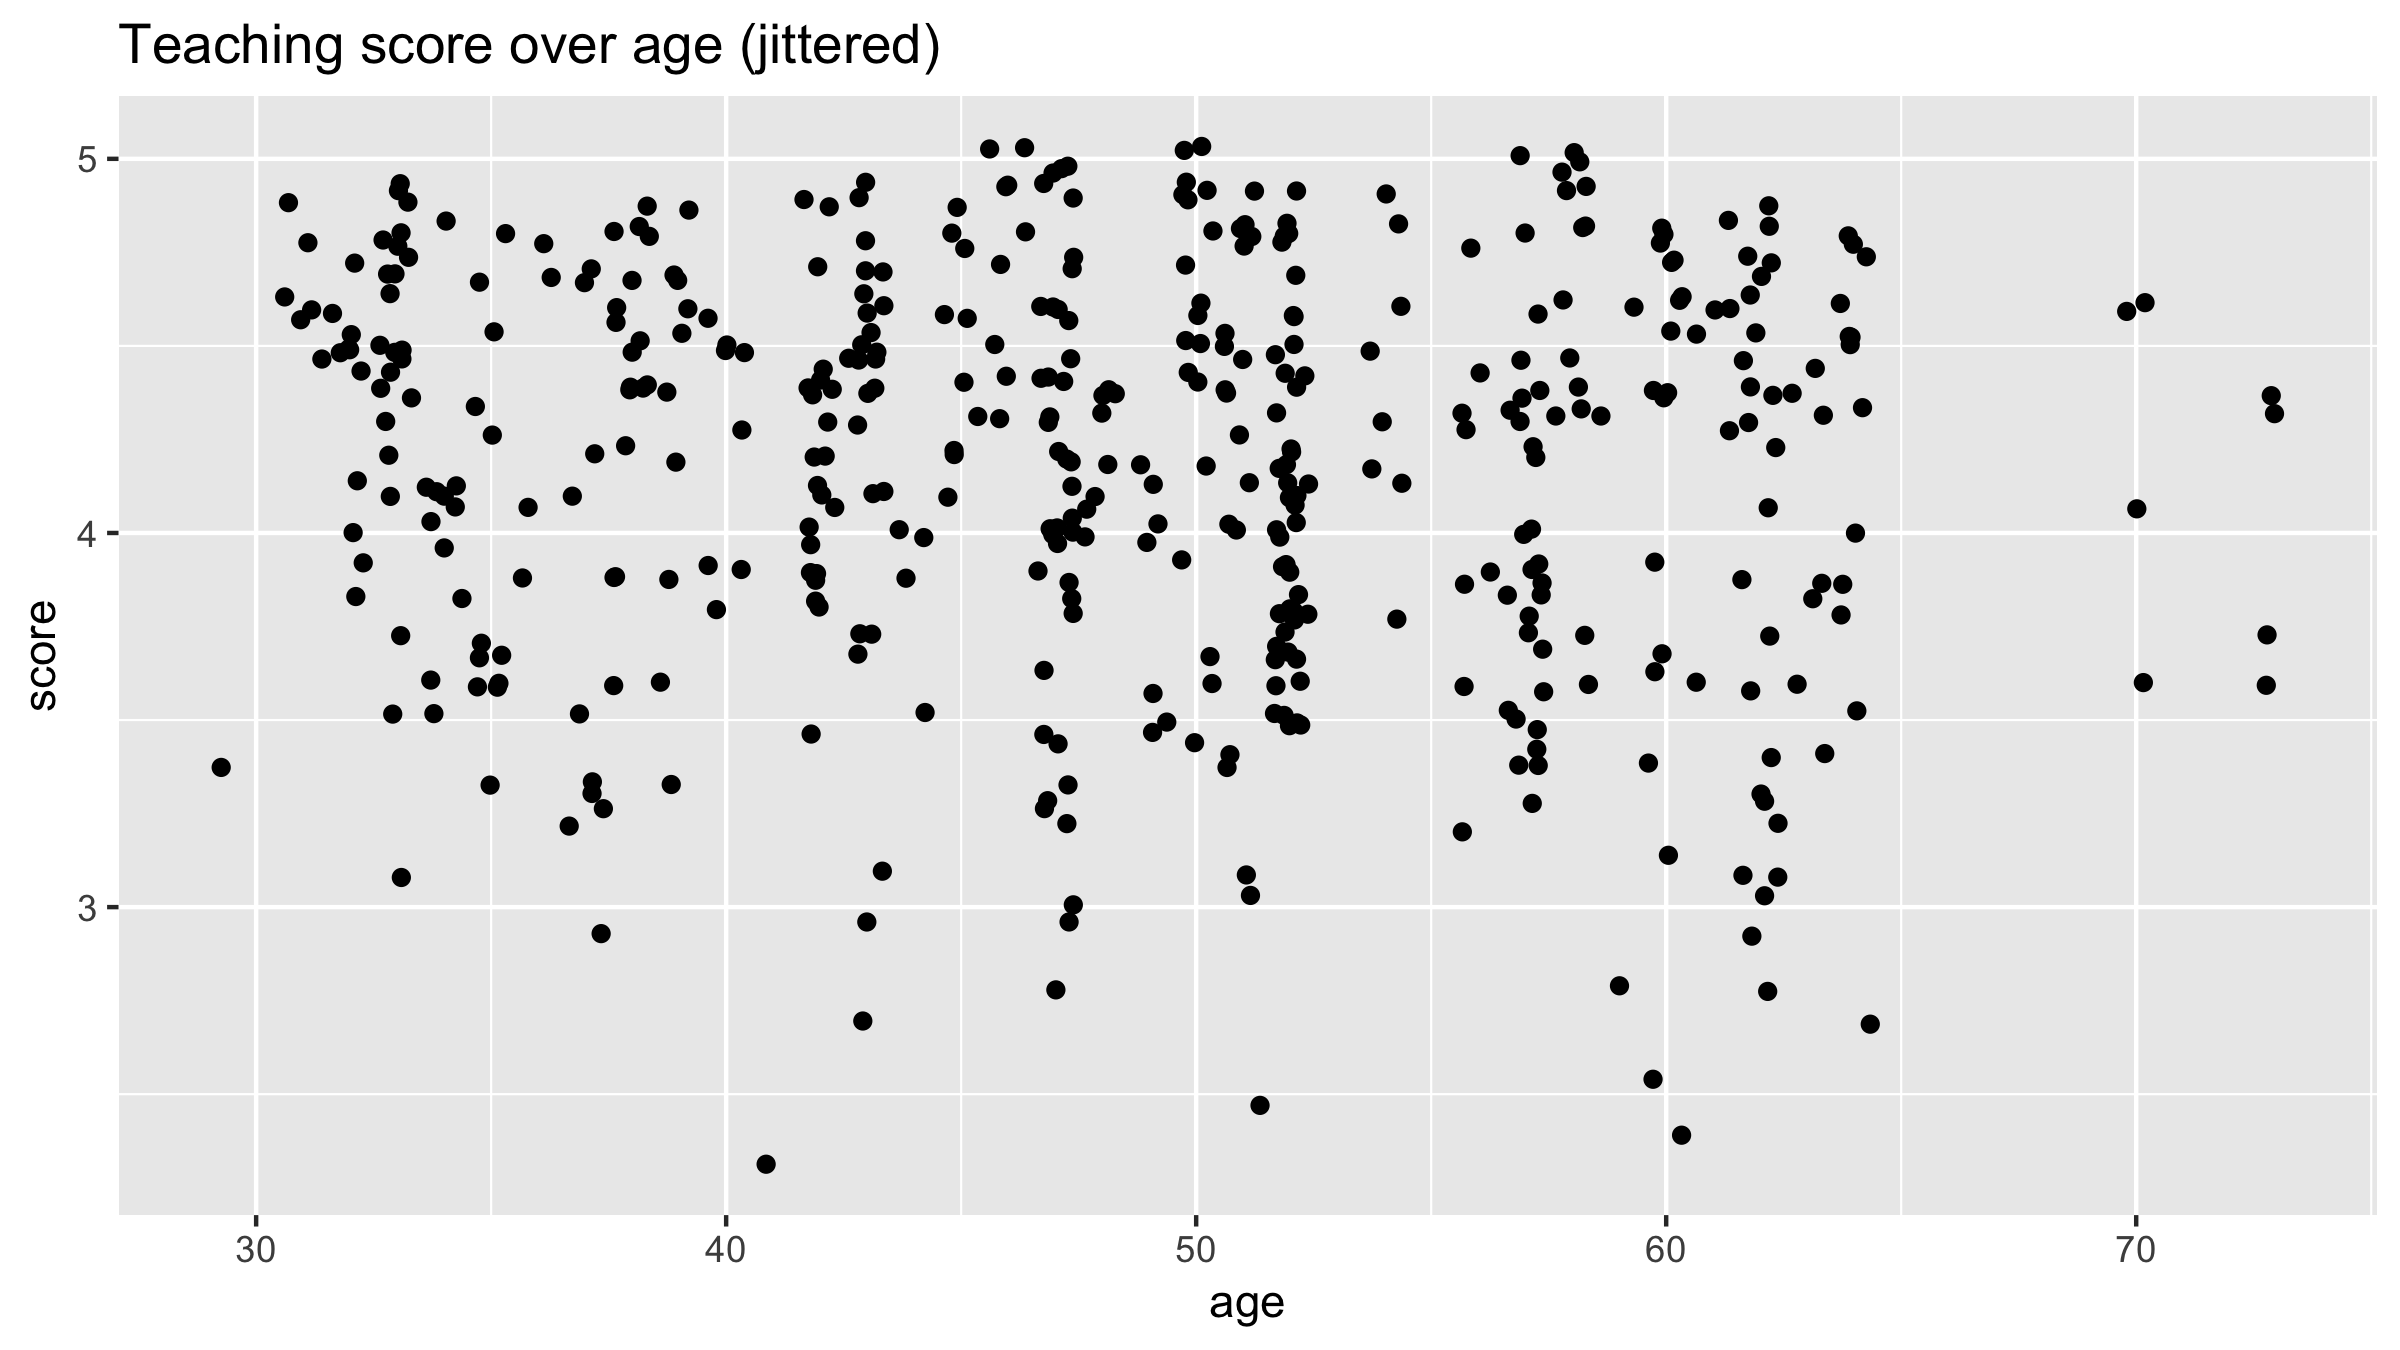
抖动散点图
library(ggplot2)
library(dplyr)
library(moderndive)

# Use geom_jitter() instead of geom_point()
ggplot(evals, aes(x = age, y = score)) +
  geom_jitter() +
  labs(x = "age", y = "score",
       title = "Teaching score over age (jittered)")