ggplot2 数据可视化进阶
Rick Scavetta
Founder, Scavetta Academy
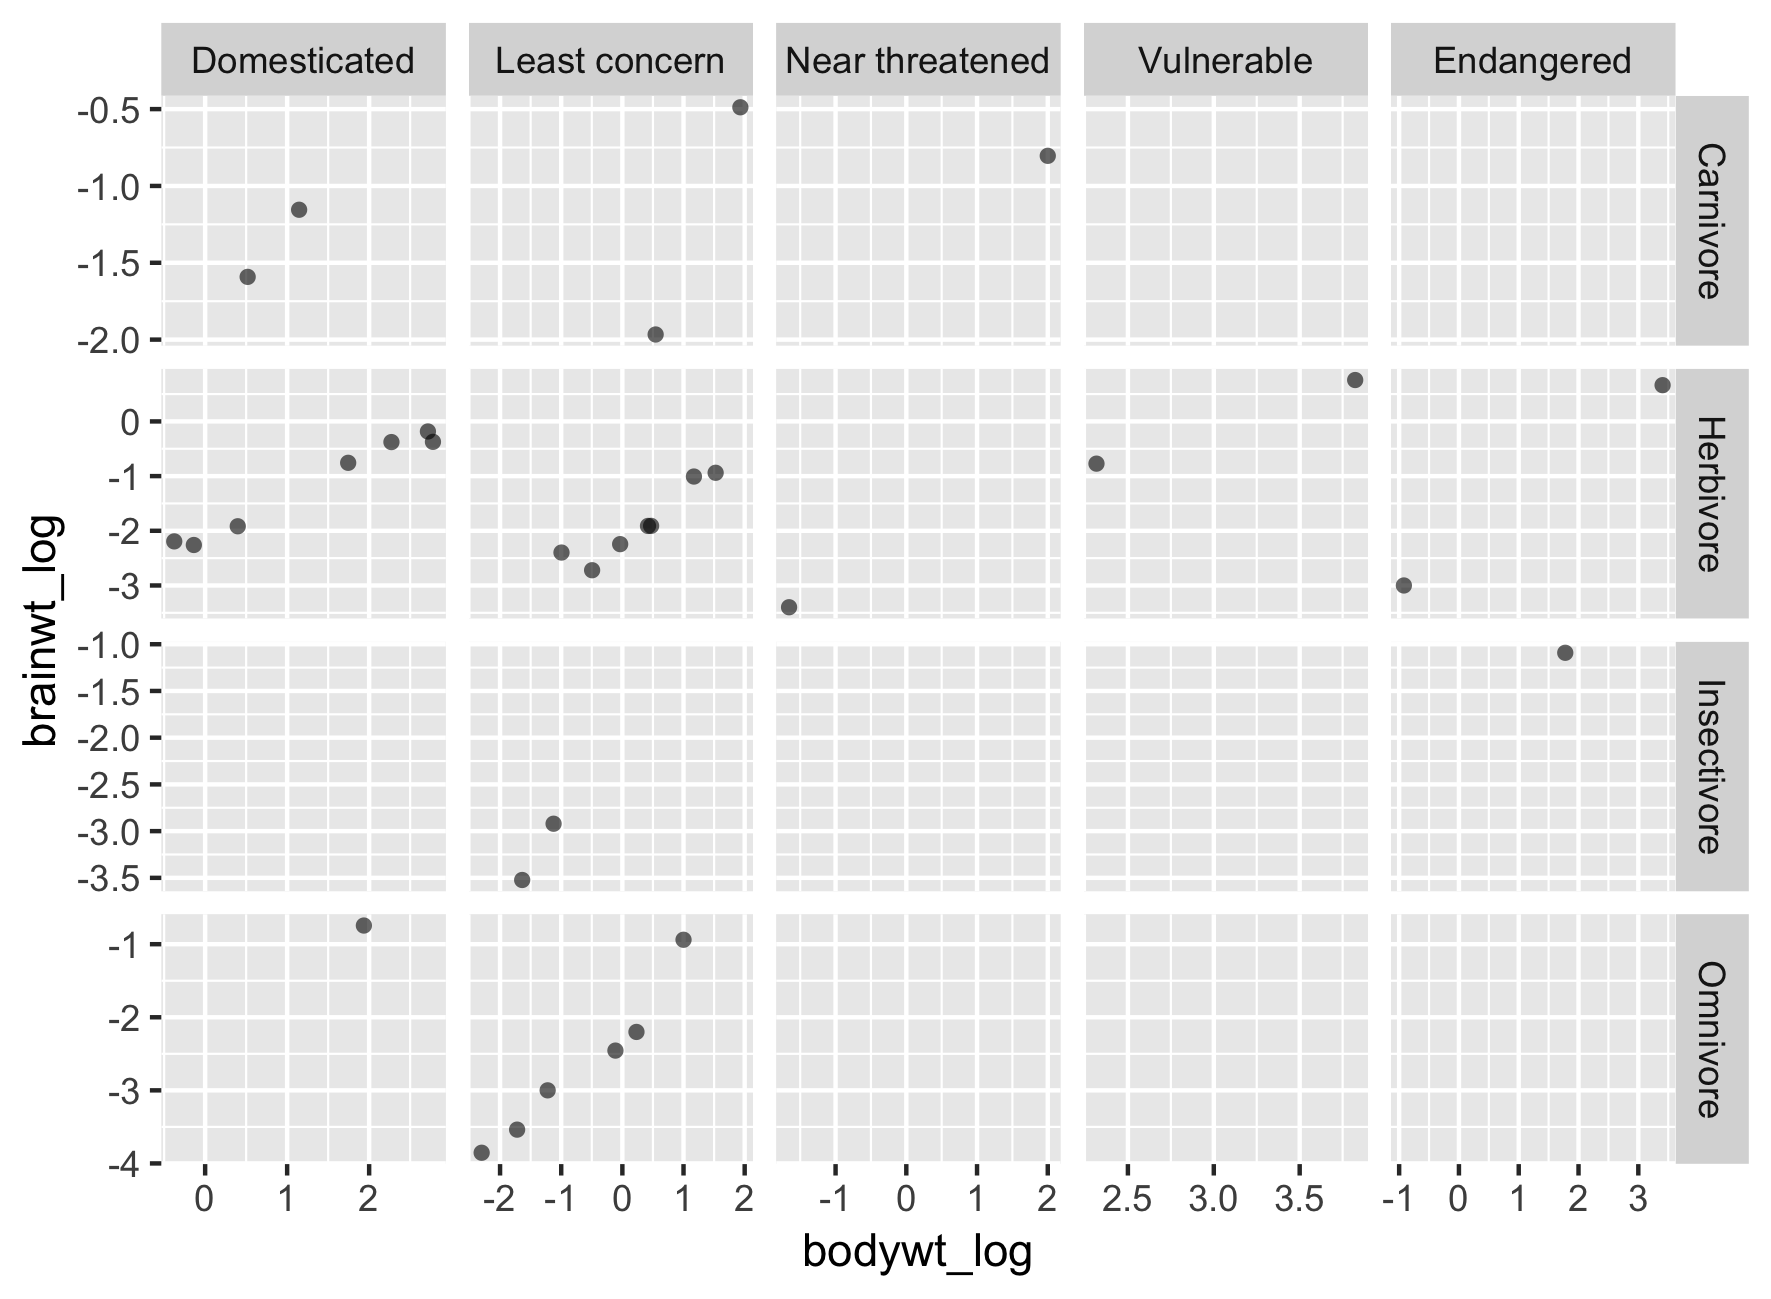
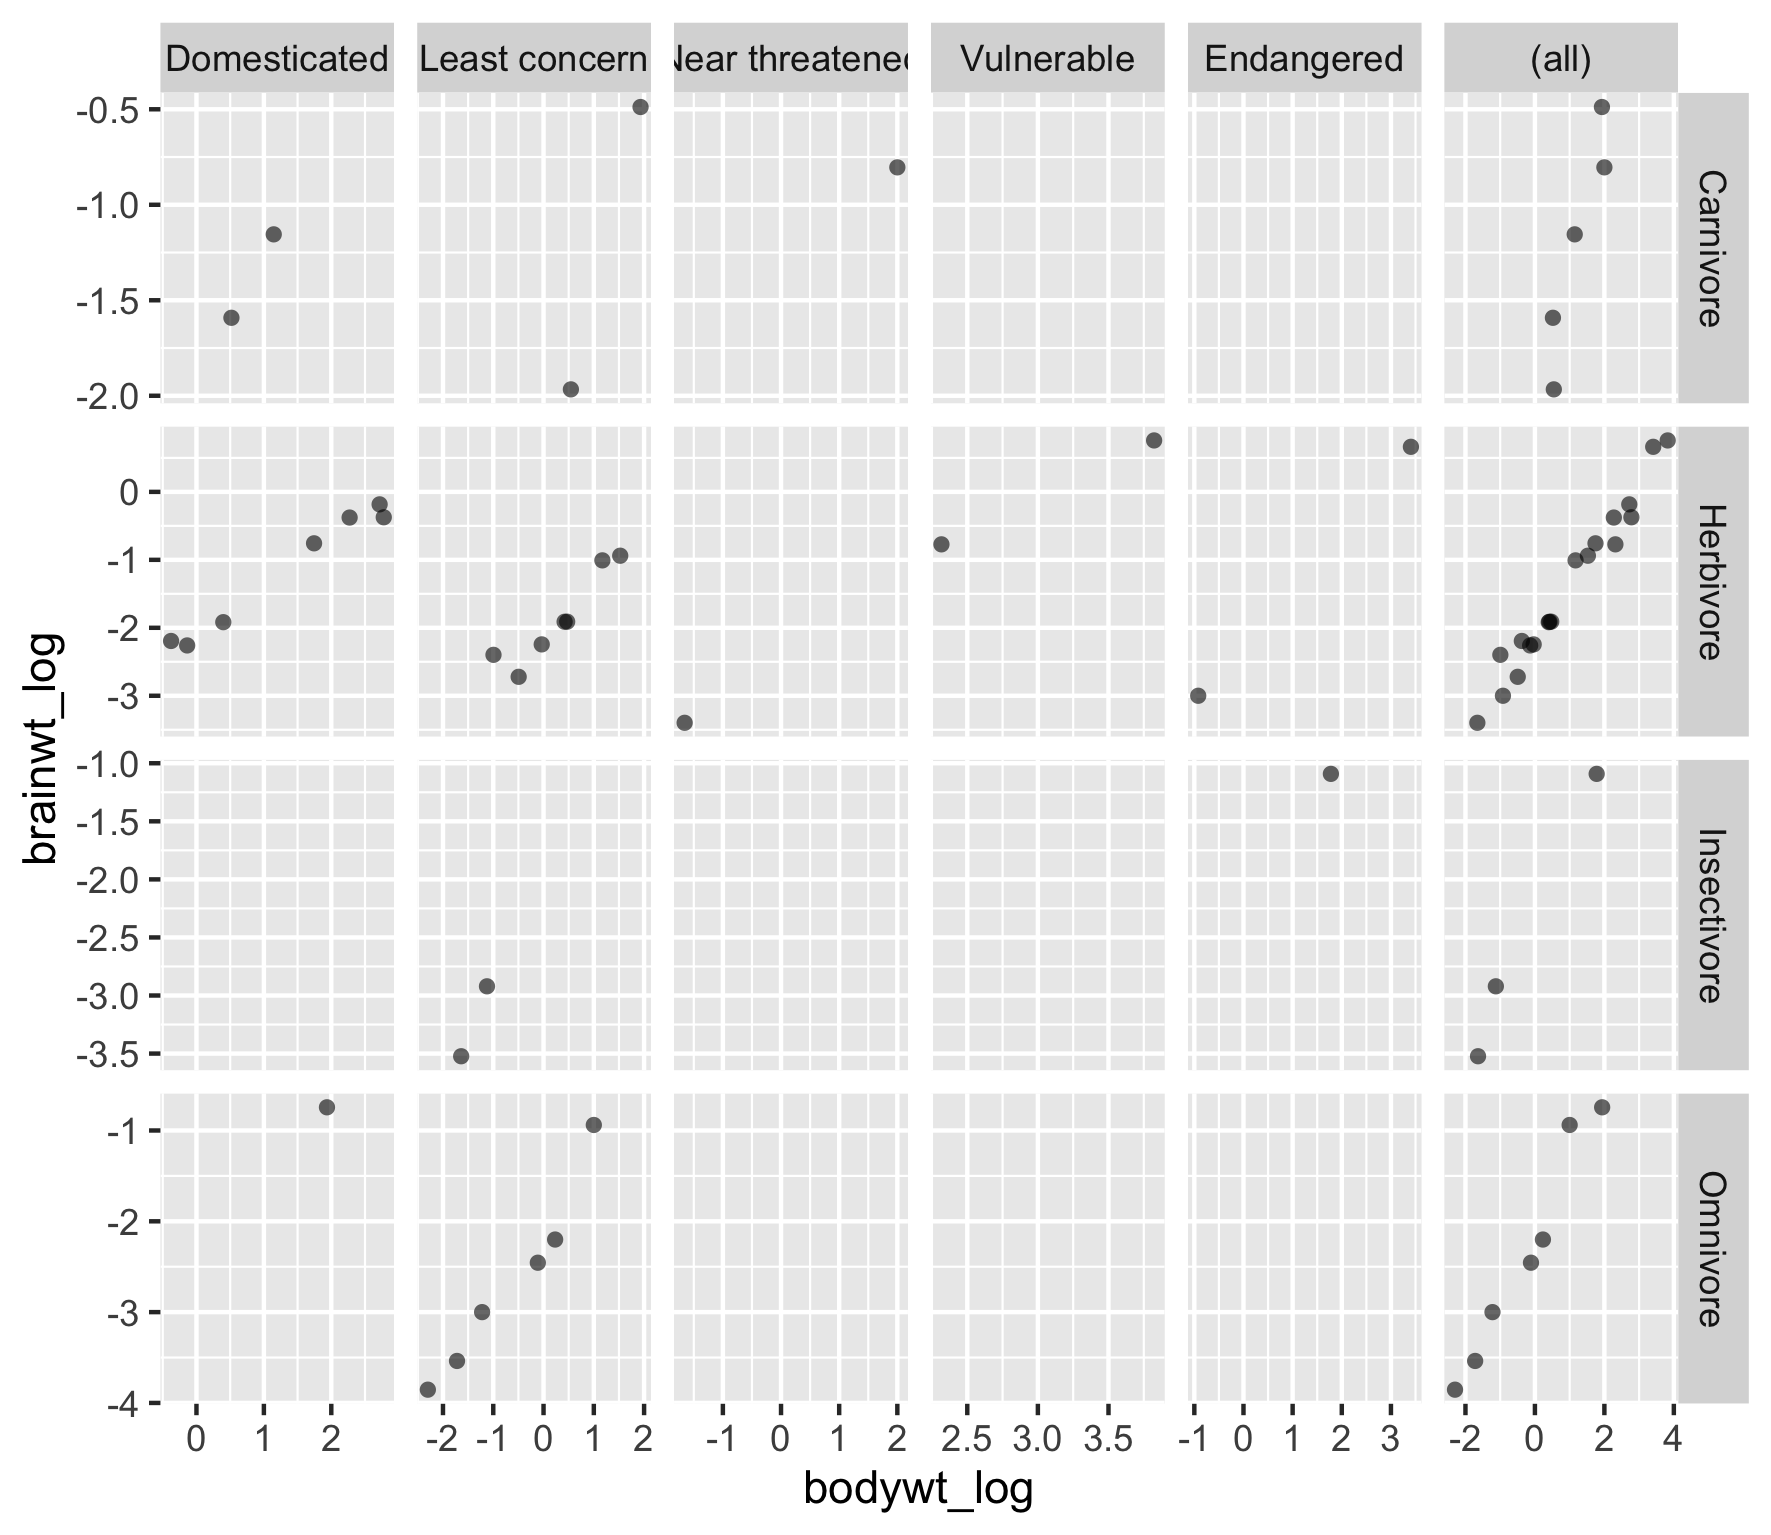
ggplot(msleep2, aes(bodywt_log,
                    brainwt_log)) +
  geom_point(alpha = 0.6, shape = 16) +
  facet_grid(rows = vars(vore),
             cols = vars(conservation),
             scales = "free")
适用场景:
facet_grid()
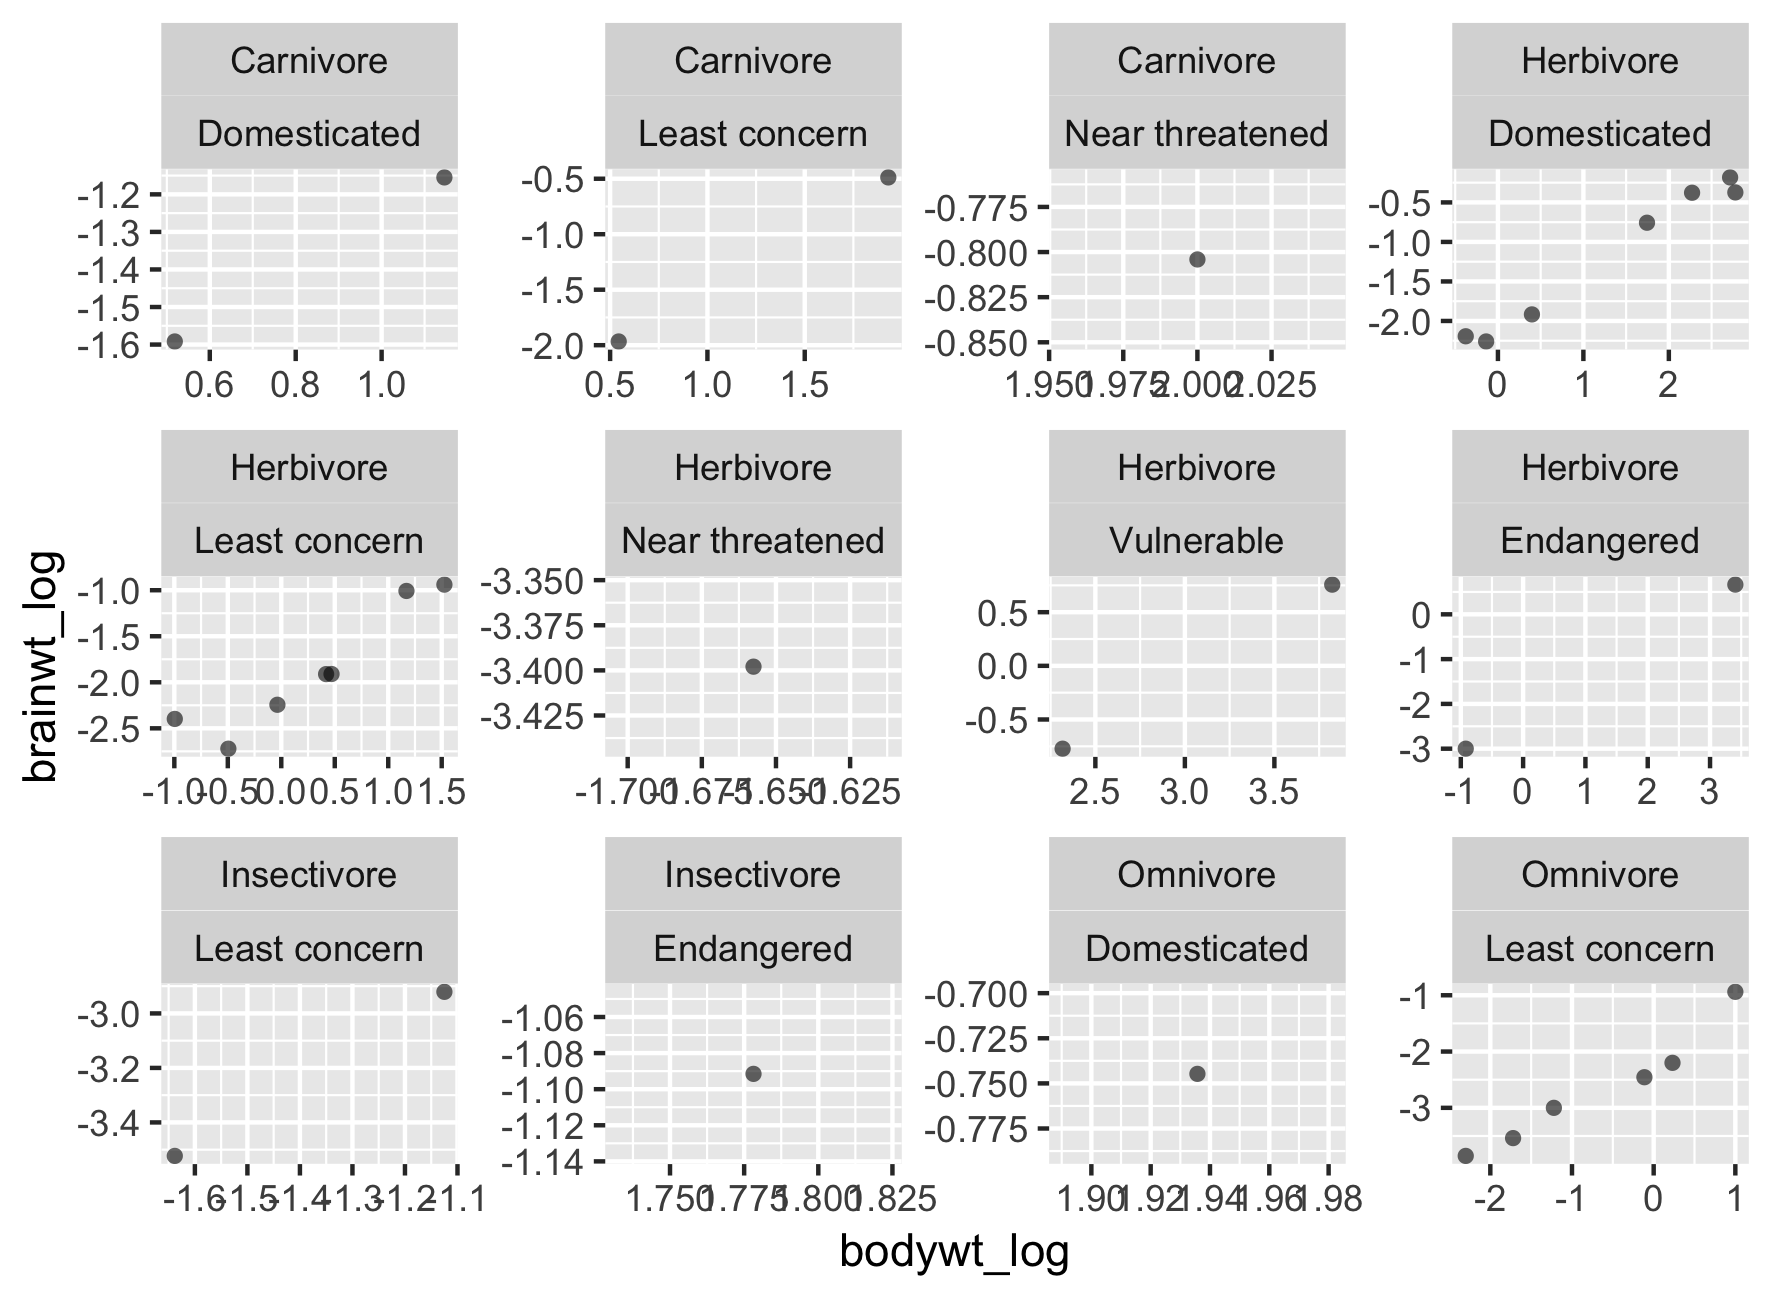
ggplot(msleep2, aes(bodywt_log,
                    brainwt_log)) +
  geom_point(alpha = 0.6, shape = 16) +
  facet_wrap(vars(vore, conservation),
             scales = "free")
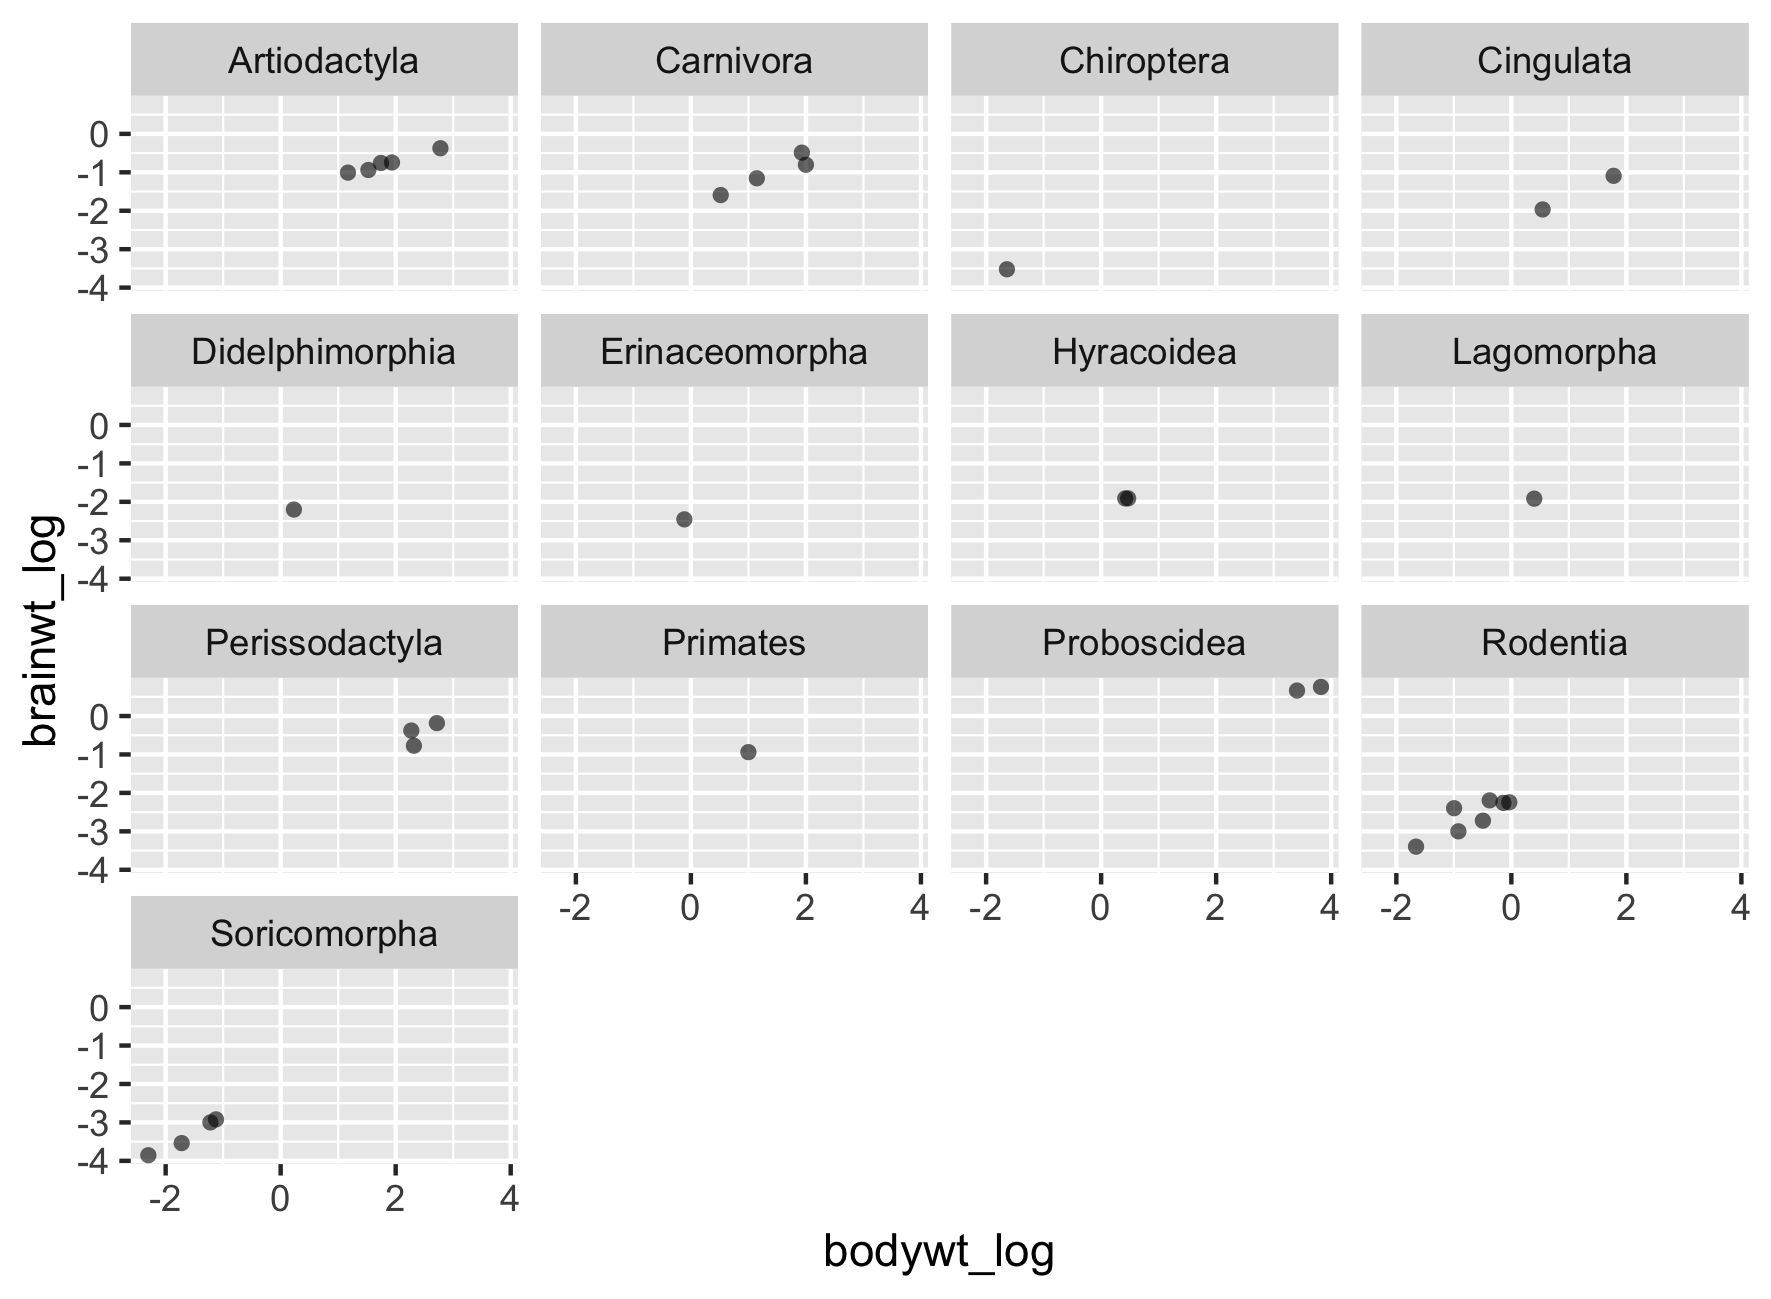
ggplot(msleep2, aes(bodywt_log,
                    brainwt_log)) +
  geom_point(alpha = 0.6, shape = 16) +
  facet_wrap(vars(order))
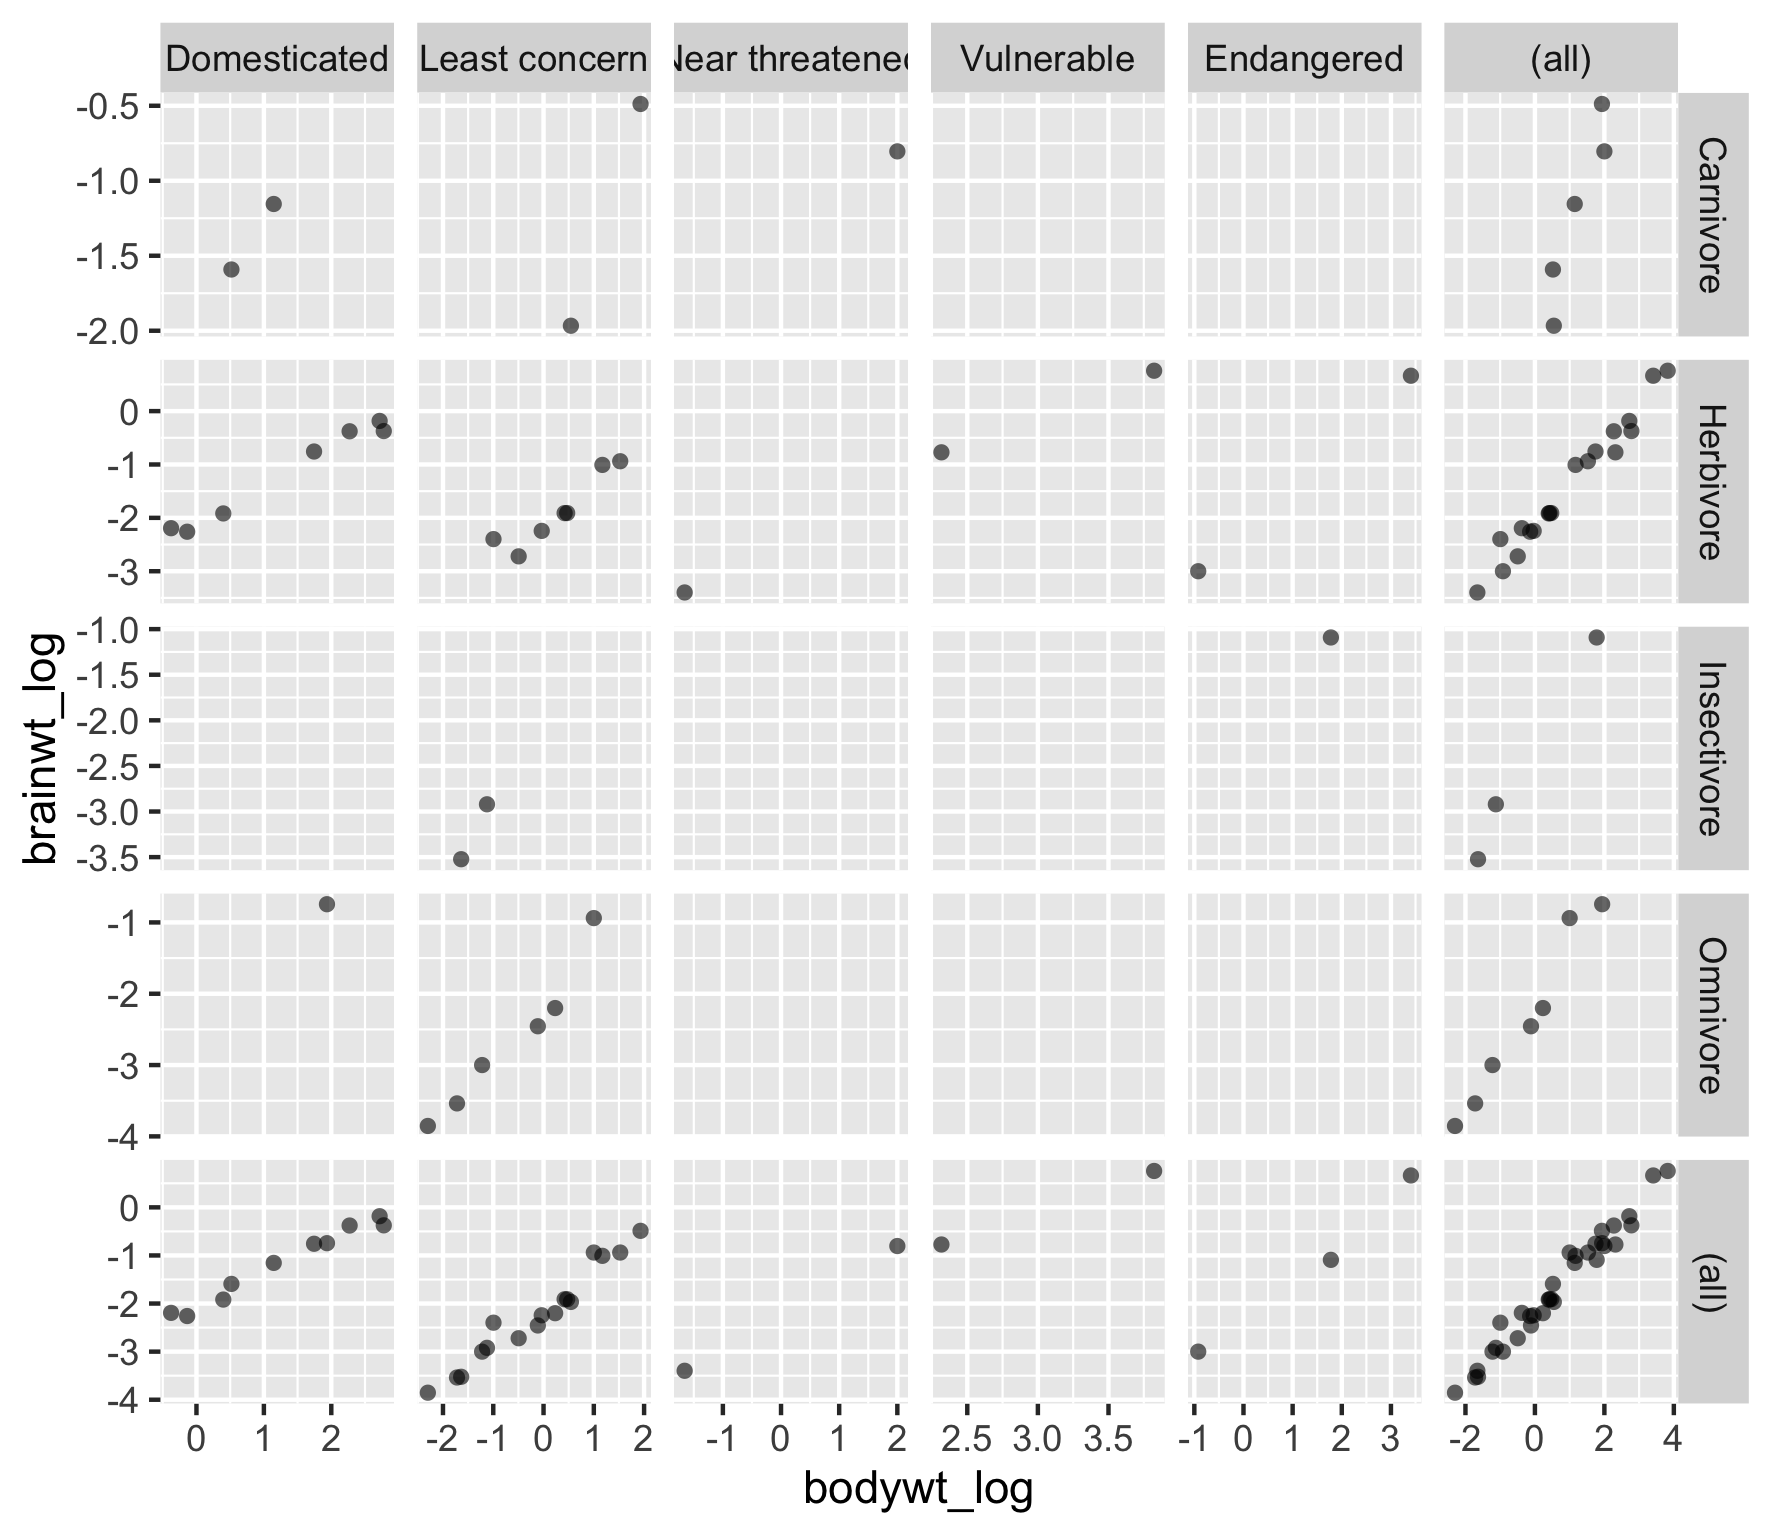
ggplot(msleep2, aes(bodywt_log,
                    brainwt_log)) +
  geom_point(alpha = 0.6, shape = 16) +
  facet_grid(rows = vars(vore),
             cols = vars(conservation),
             scales = "free",
             margins = TRUE)
ggplot(msleep2, aes(bodywt_log,
                    brainwt_log)) +
  geom_point(alpha = 0.6, shape = 16) +
  facet_grid(rows = vars(vore),
             cols = vars(conservation),
             scales = "free",
             margins = "conservation")