分面图层

ggplot2 数据可视化进阶

Rick Scavetta

Founder, Scavetta Academy
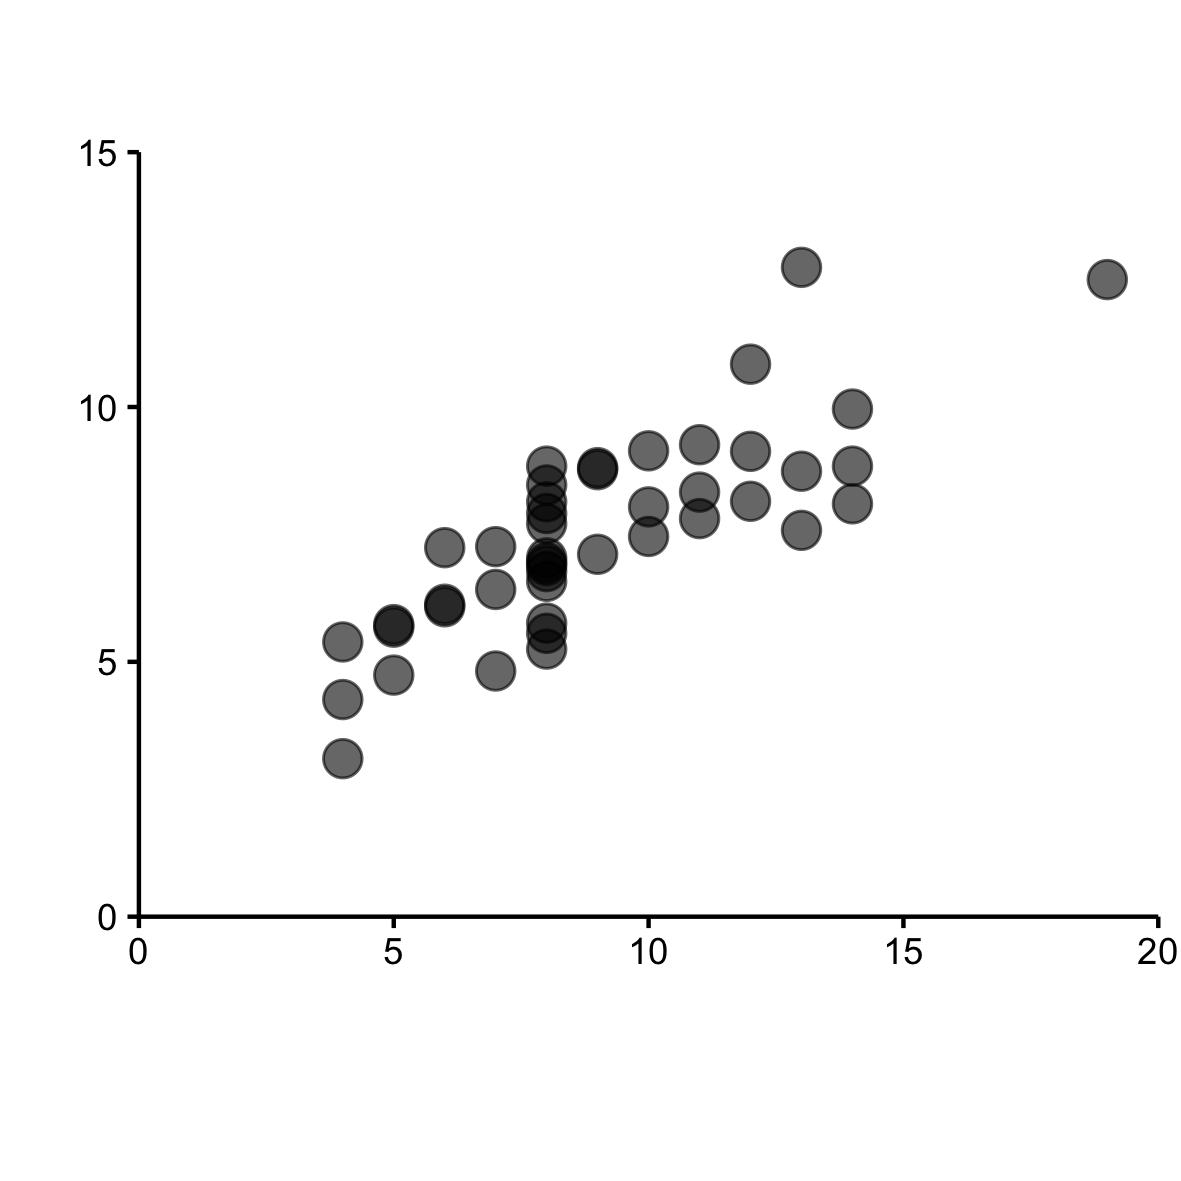
分面(Facets)

  • 简单但有用
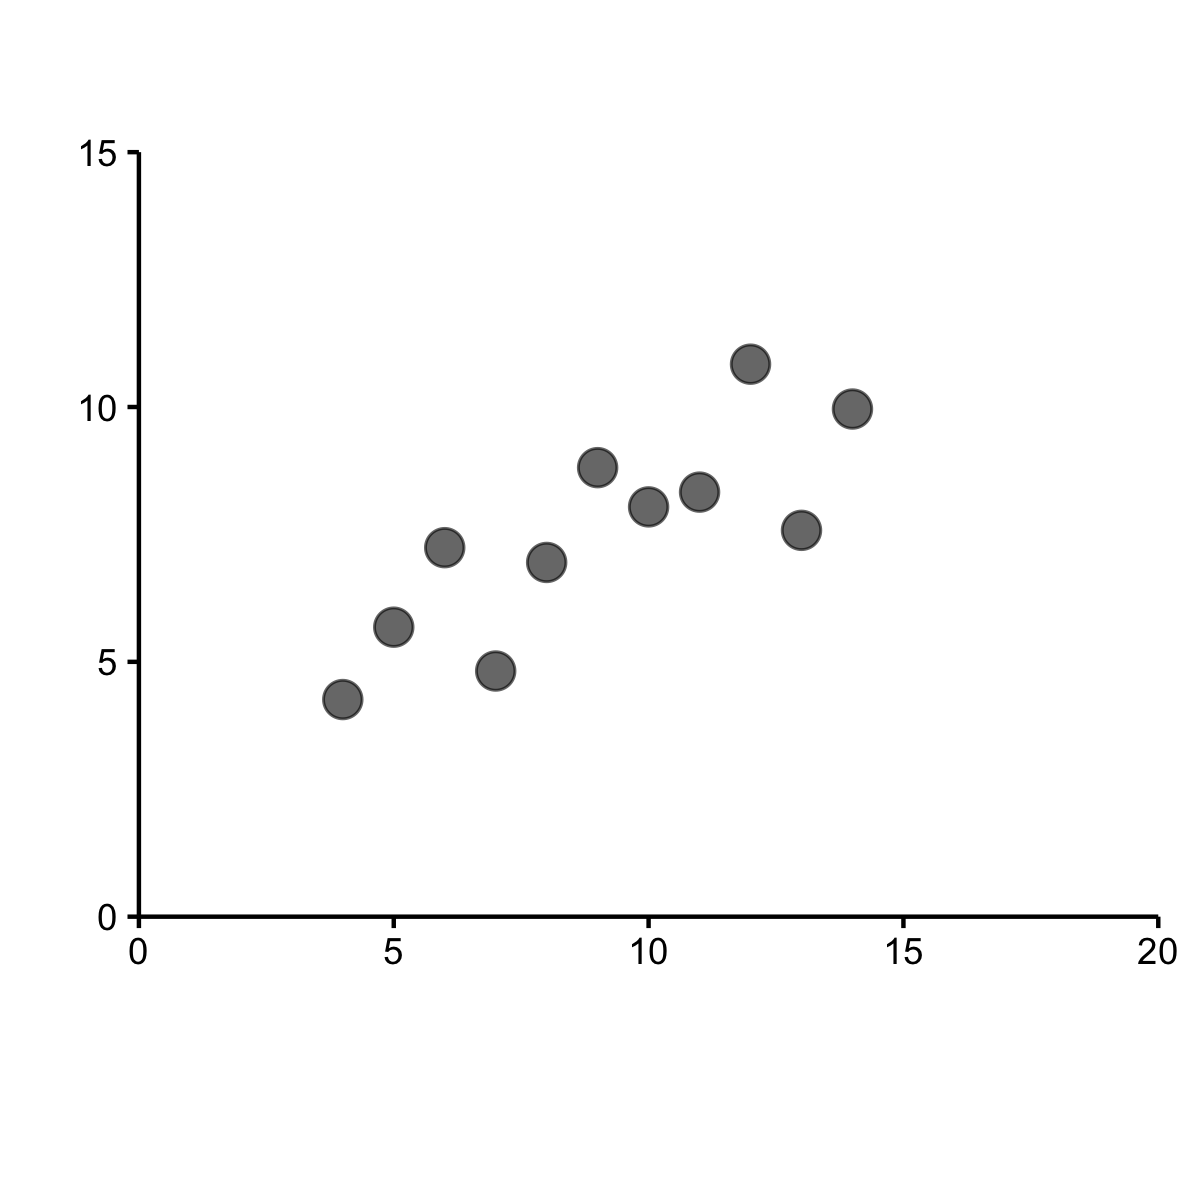
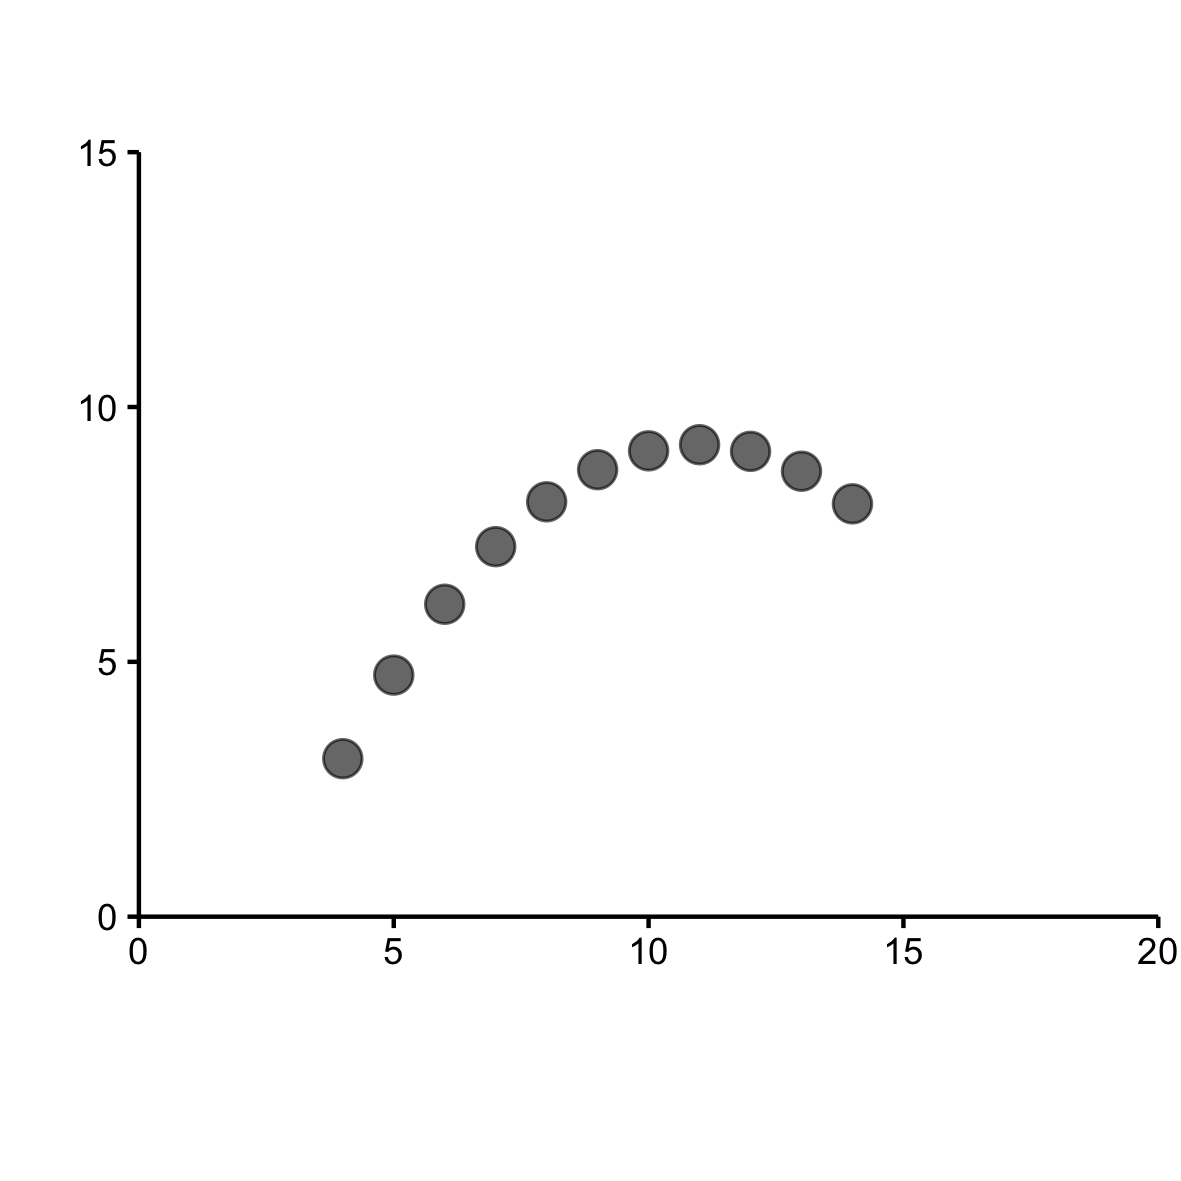
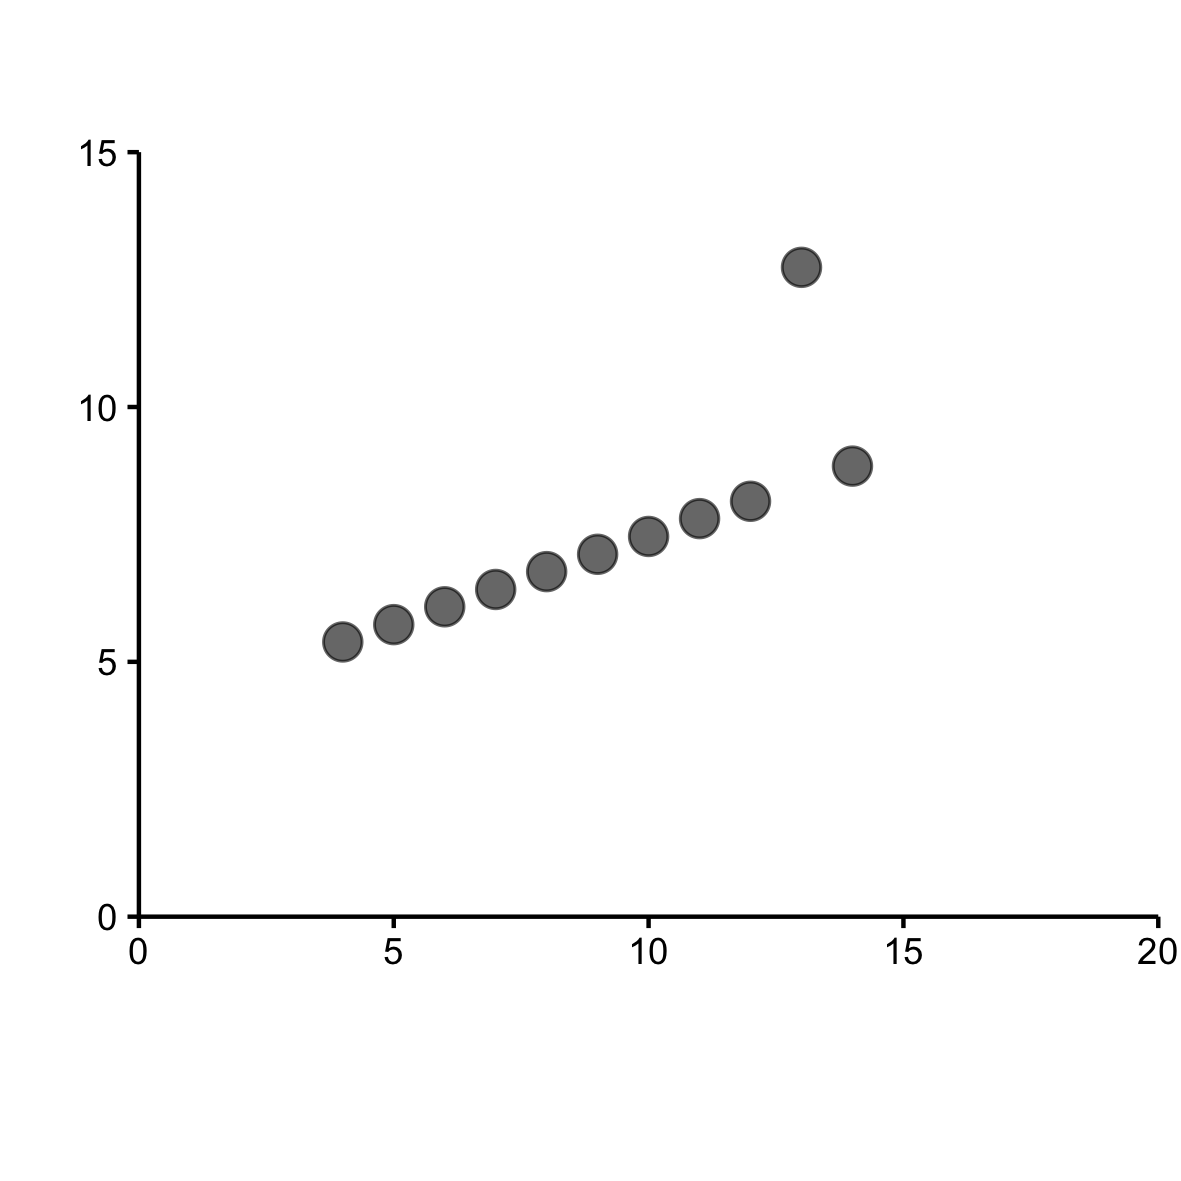
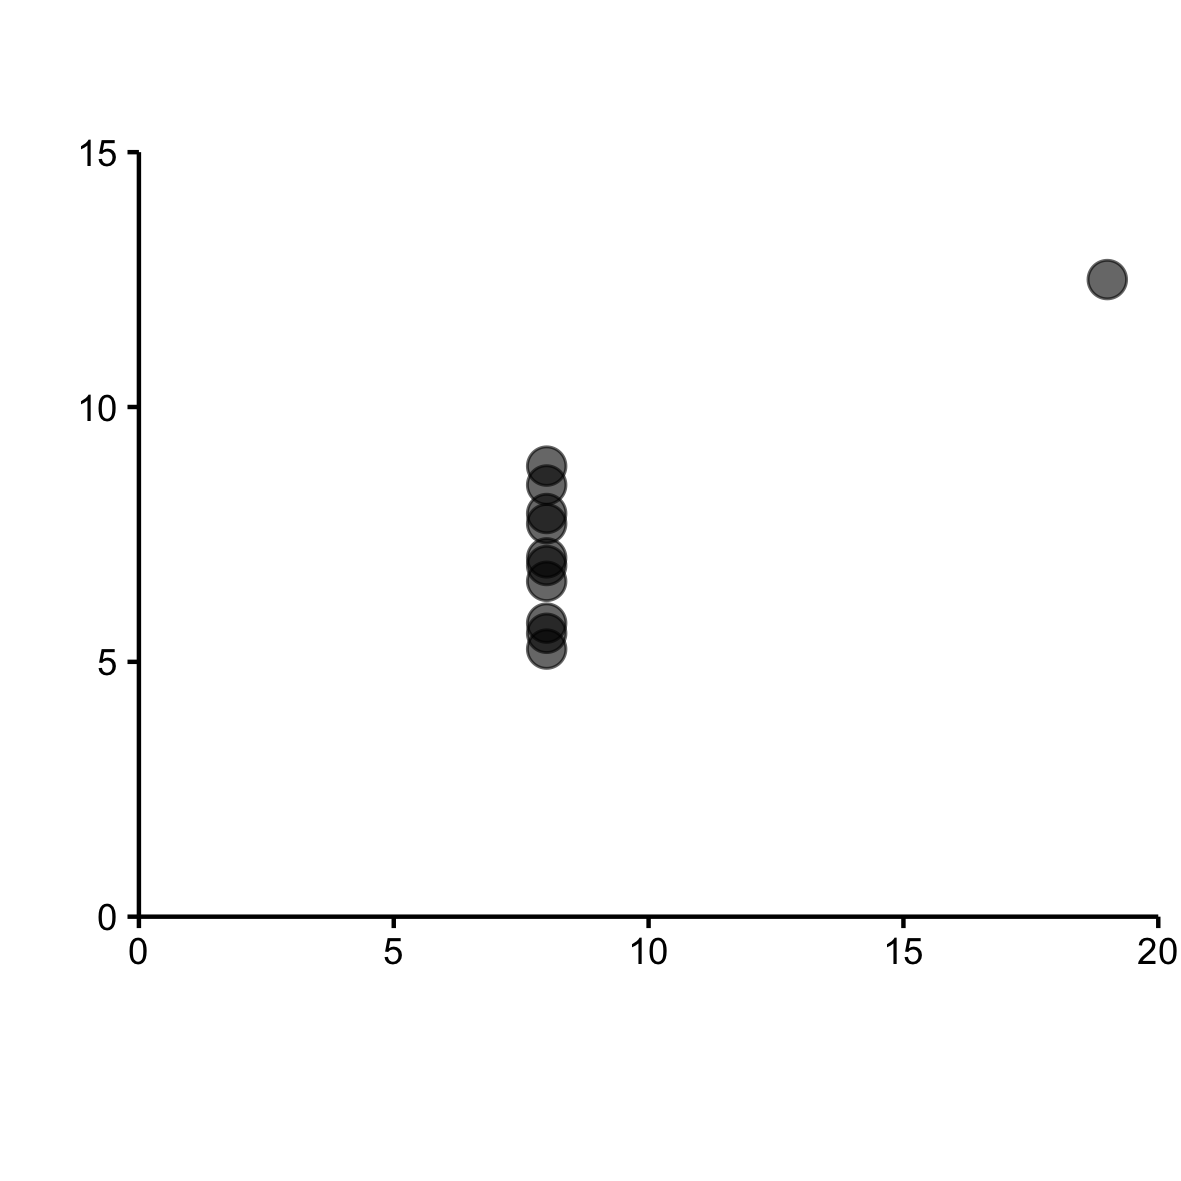
  • 小倍数(Small Multiples)的概念
    • 由 Edward Tufte 推广
    • 《数量信息的可视化》,1983
ggplot2 数据可视化进阶

ggplot2 数据可视化进阶

ggplot2 数据可视化进阶

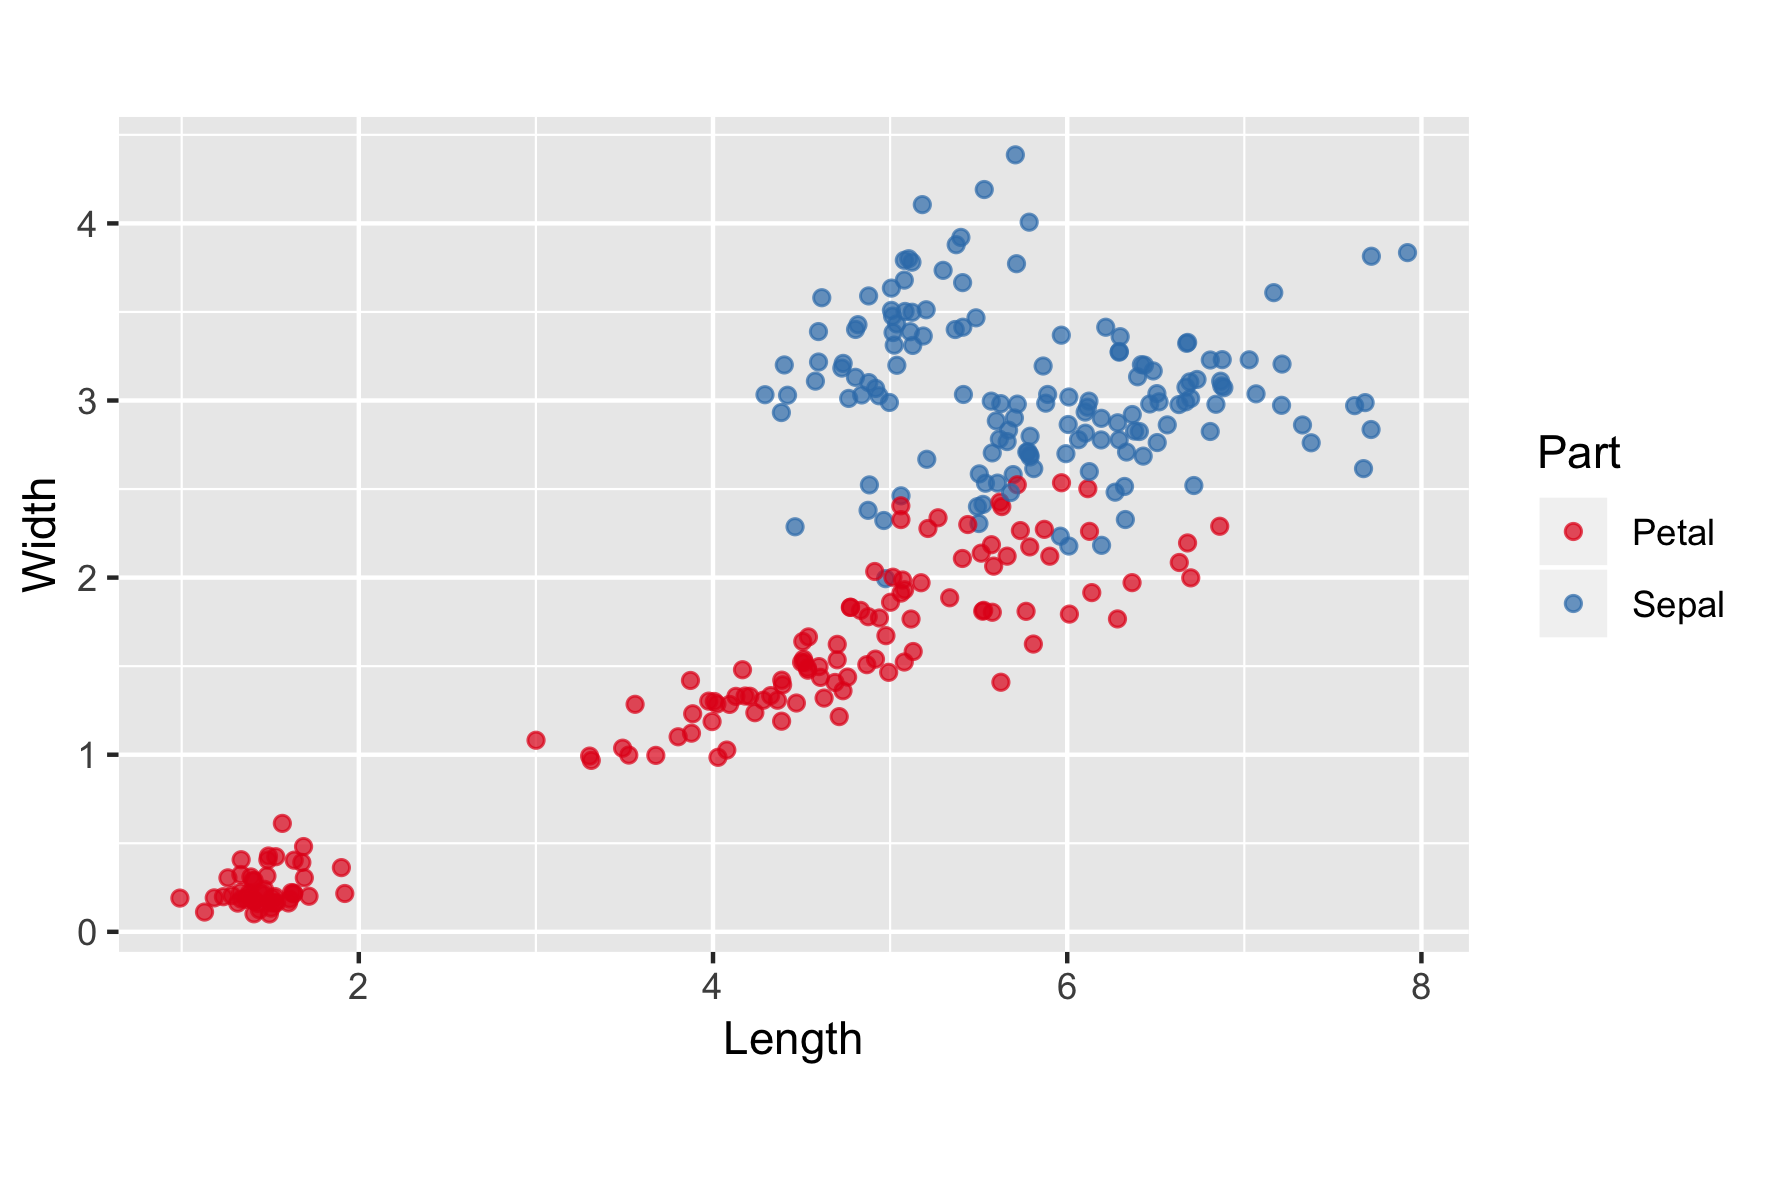
iris.wide

p <- ggplot(iris.wide, aes(x = Length, 
                           y = Width, 
                           ccolorol = Part)) +
  geom_jitter(alpha = 0.7) +
  scale_color_brewer(palette = "Set1") +
  coord_fixed()

p

ggplot2 数据可视化进阶

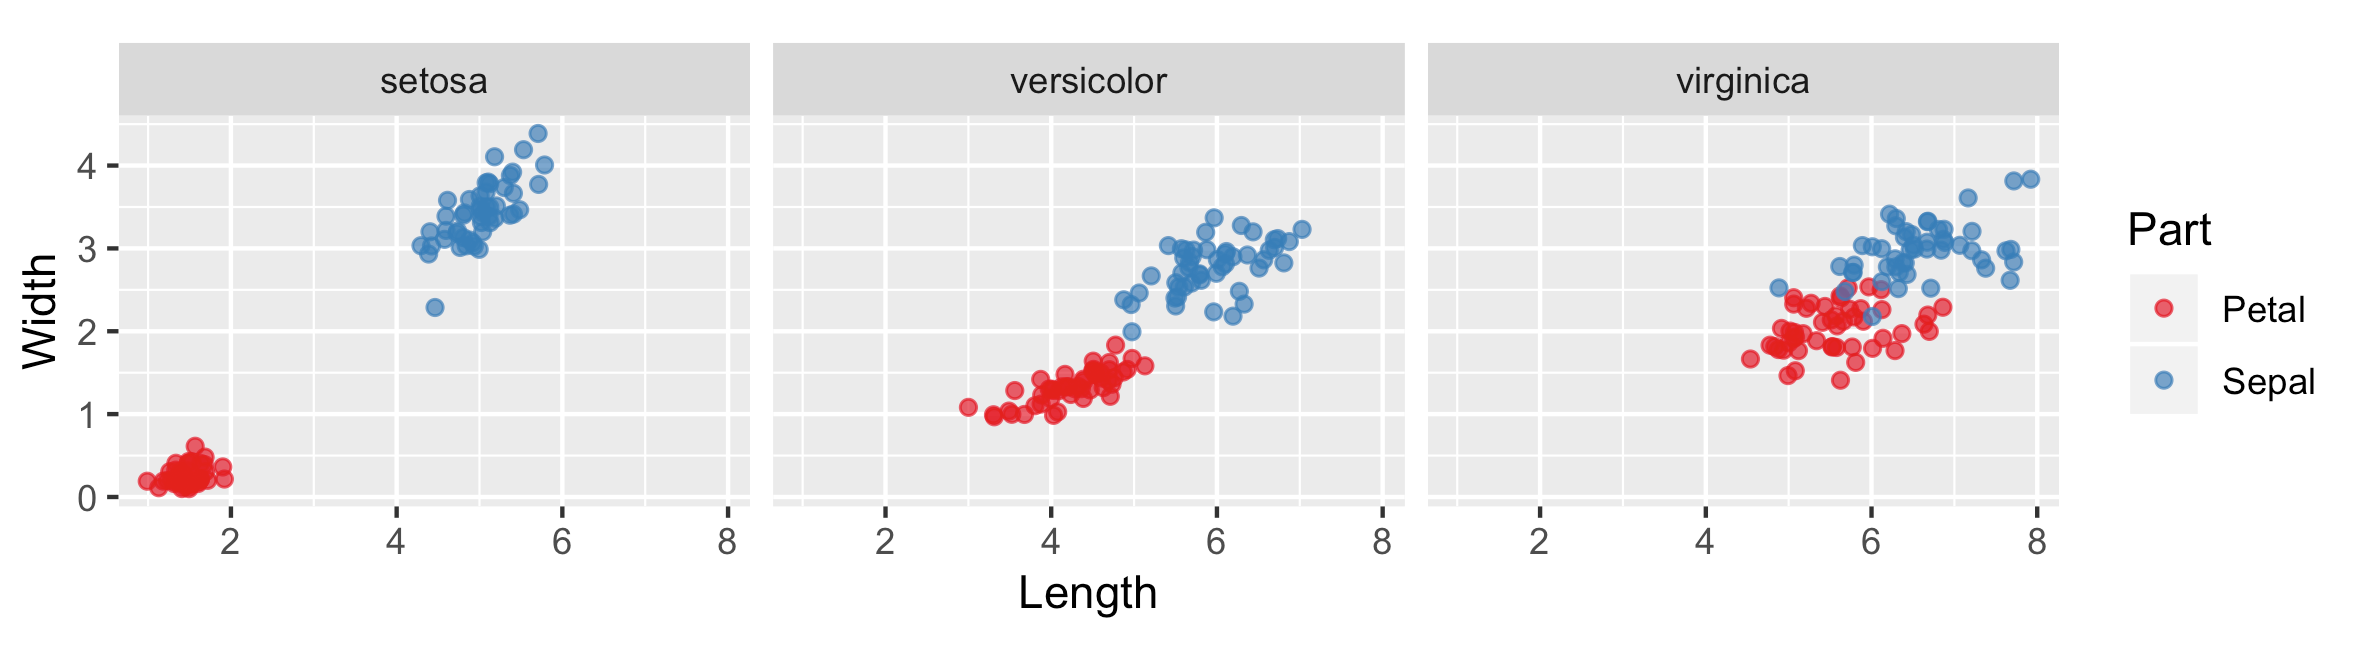
iris.wide 与 facet_grid()

p <- ggplot(iris.wide, aes(x = Length, y = Width, color = Part)) +
  geom_jitter(alpha = 0.7) +
  scale_color_brewer(palette = "Set1") +
  coord_fixed()
p + facet_grid(cols = vars(Species))
ggplot2 数据可视化进阶

公式表示法

p <- ggplot(iris.wide, aes(x = Length, y = Width, color = Part)) +
  geom_jitter(alpha = 0.7) +
  scale_color_brewer(palette = "Set1") +
  coord_fixed()
p + facet_grid(. ~ Species)

ggplot2 数据可视化进阶

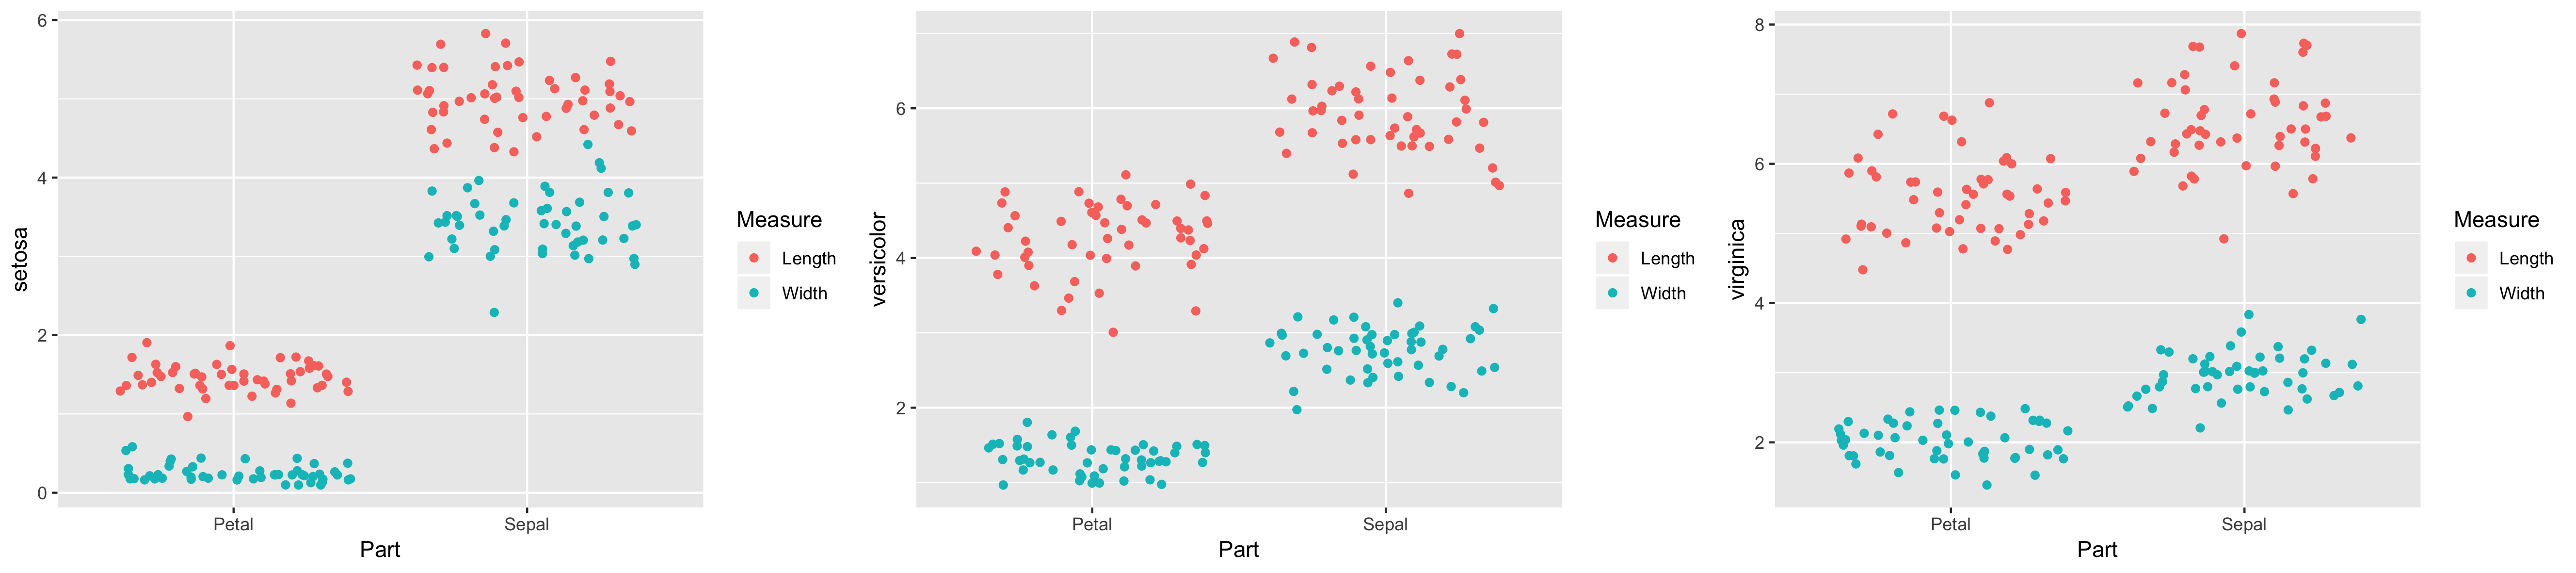
iris.wide2

ggplot(iris.wide2, aes(x = Part, y = setosa, color = Measure)) +
  geom_jitter()
ggplot(iris.wide2, aes(x = Part, y = versicolor, color = Measure)) +
  geom_jitter()  
ggplot(iris.wide2, aes(x = Part, y = virginica, color = Measure)) +
  geom_jitter()

ggplot2 数据可视化进阶

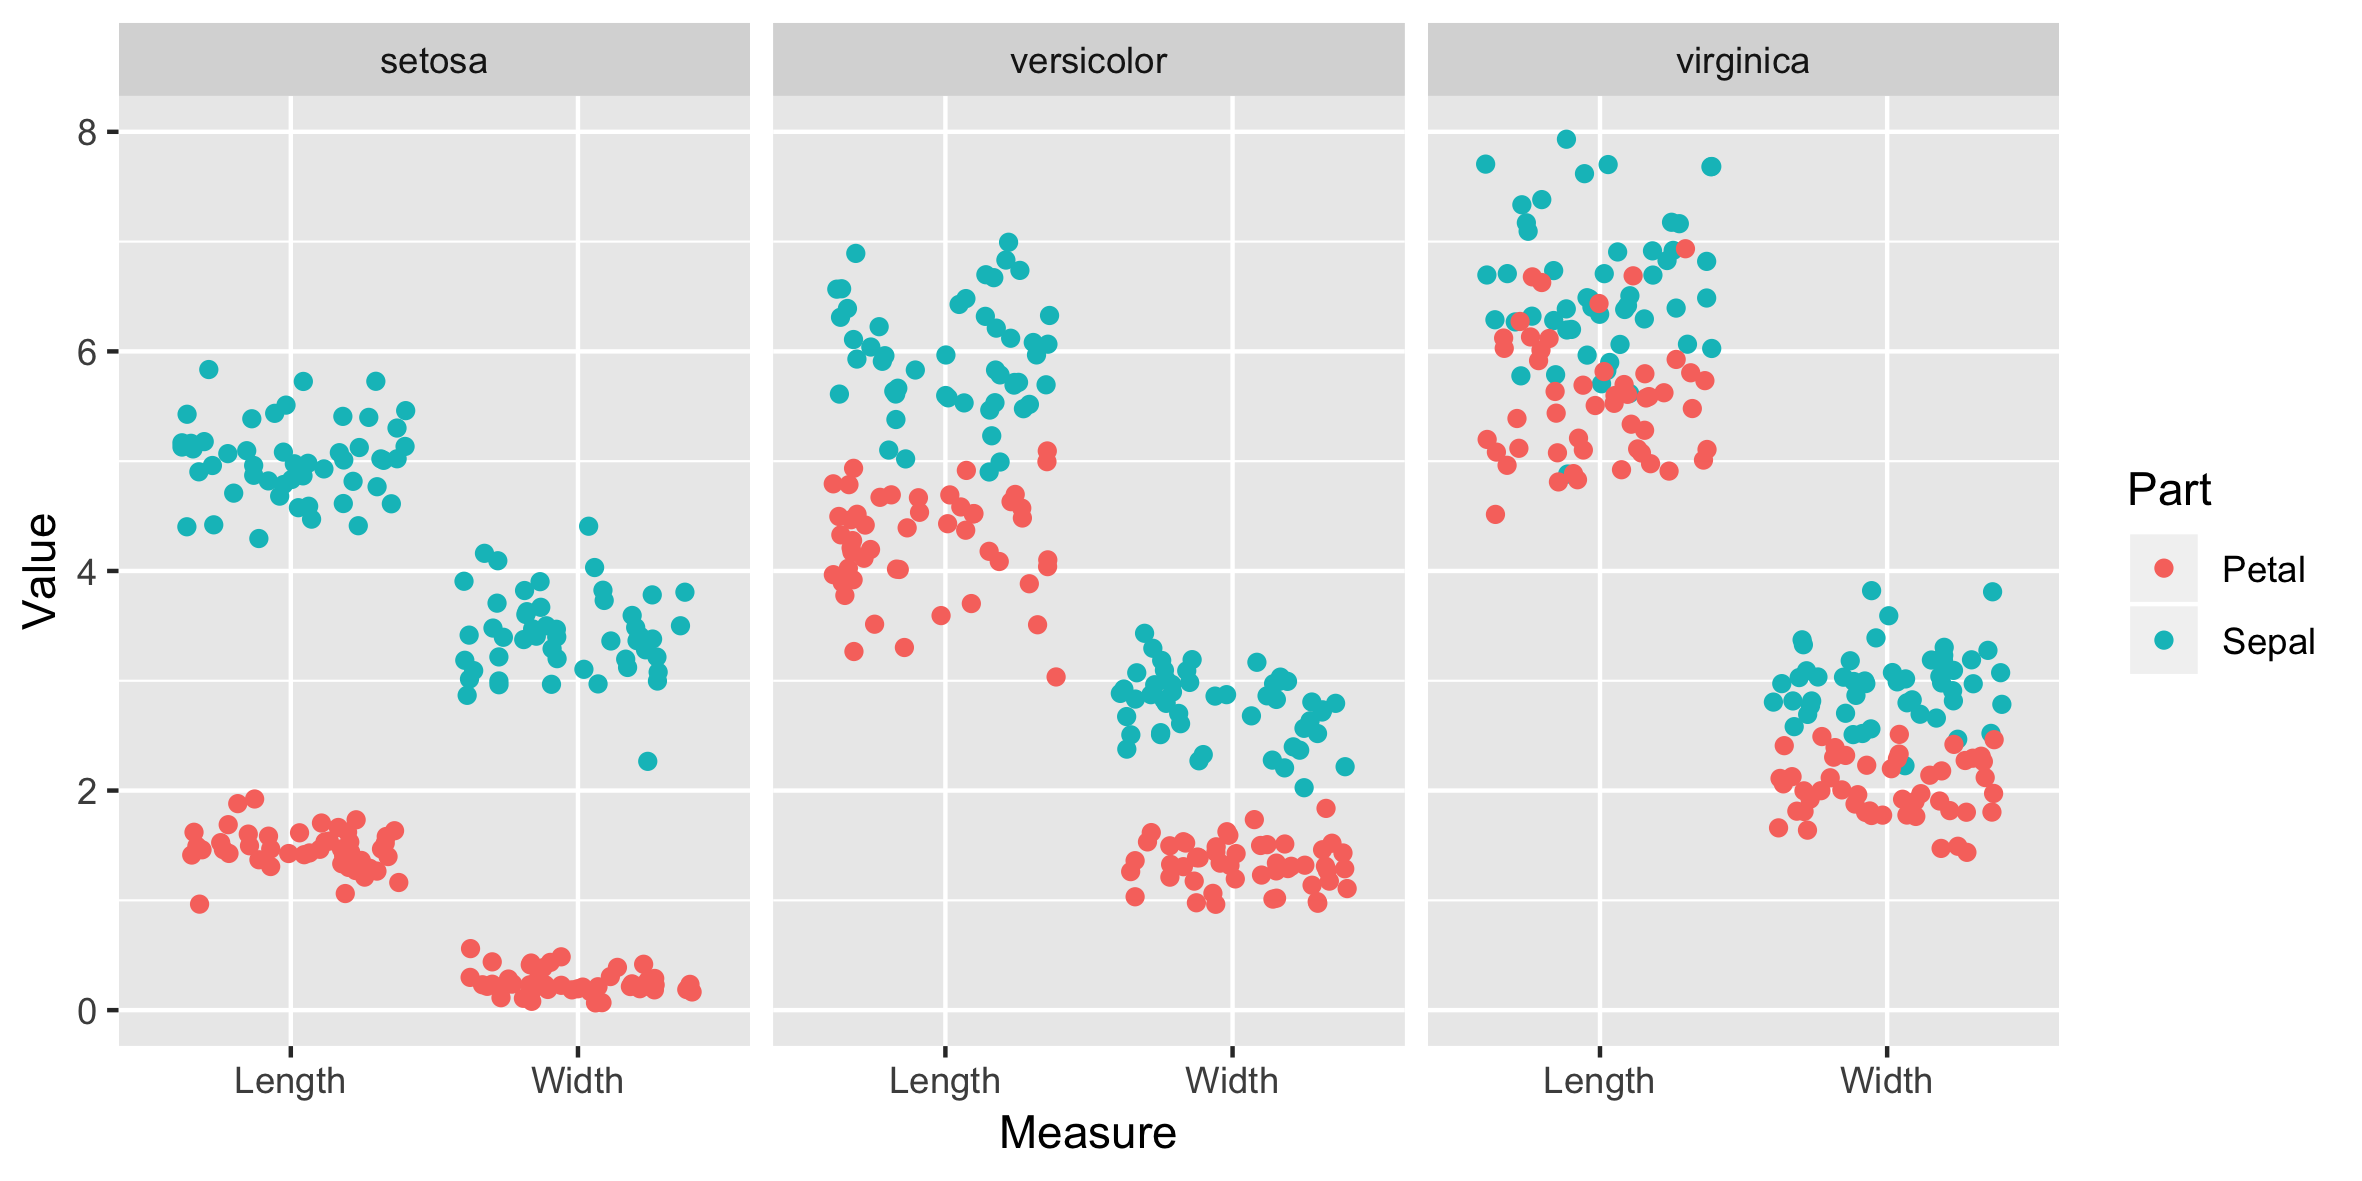
iris.tidy

ggplot(iris.tidy, aes(x = Measure, y = Value, color = Part)) +
  geom_jitter() +
  facet_grid(cols = vars(Species))
ggplot2 数据可视化进阶

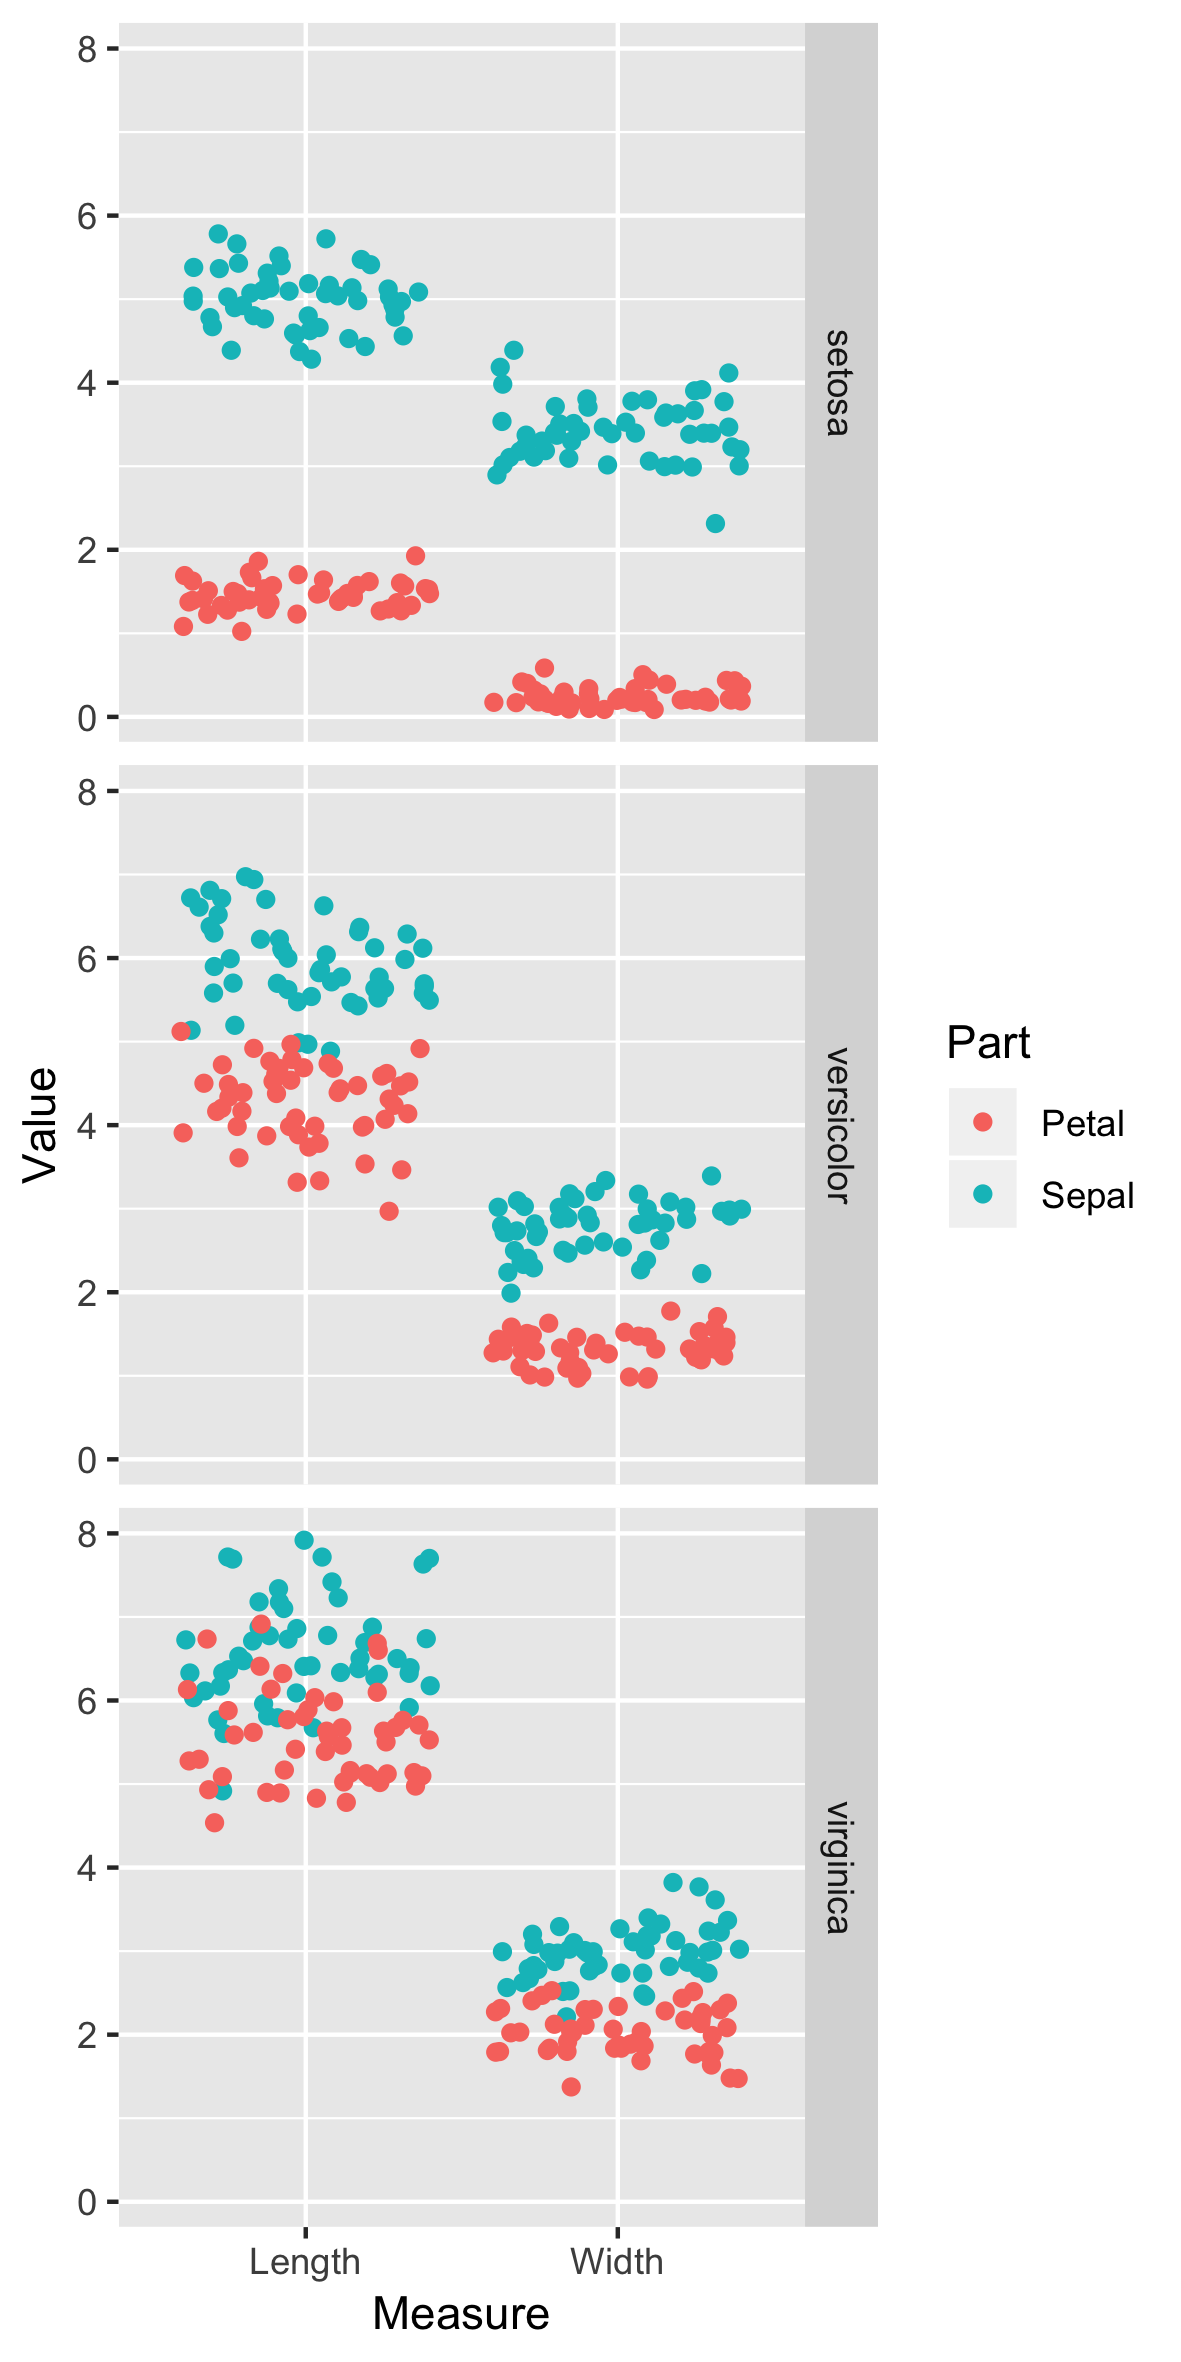
iris.tidy 分面方式示例(错误):

ggplot(iris.tidy, aes(x = Measure, 
                      y = Value, 
                      color = Part)) +
  geom_jitter() +
  facet_grid(rows = vars(Species))

ggplot2 数据可视化进阶

其他选项

  • 可按行与列拆分
ggplot2 数据可视化进阶

让我们练习吧!

ggplot2 数据可视化进阶

Preparing Video For Download...