监控与可视化

端到端机器学习

Joshua Stapleton

Machine Learning Engineer

接下来做什么?

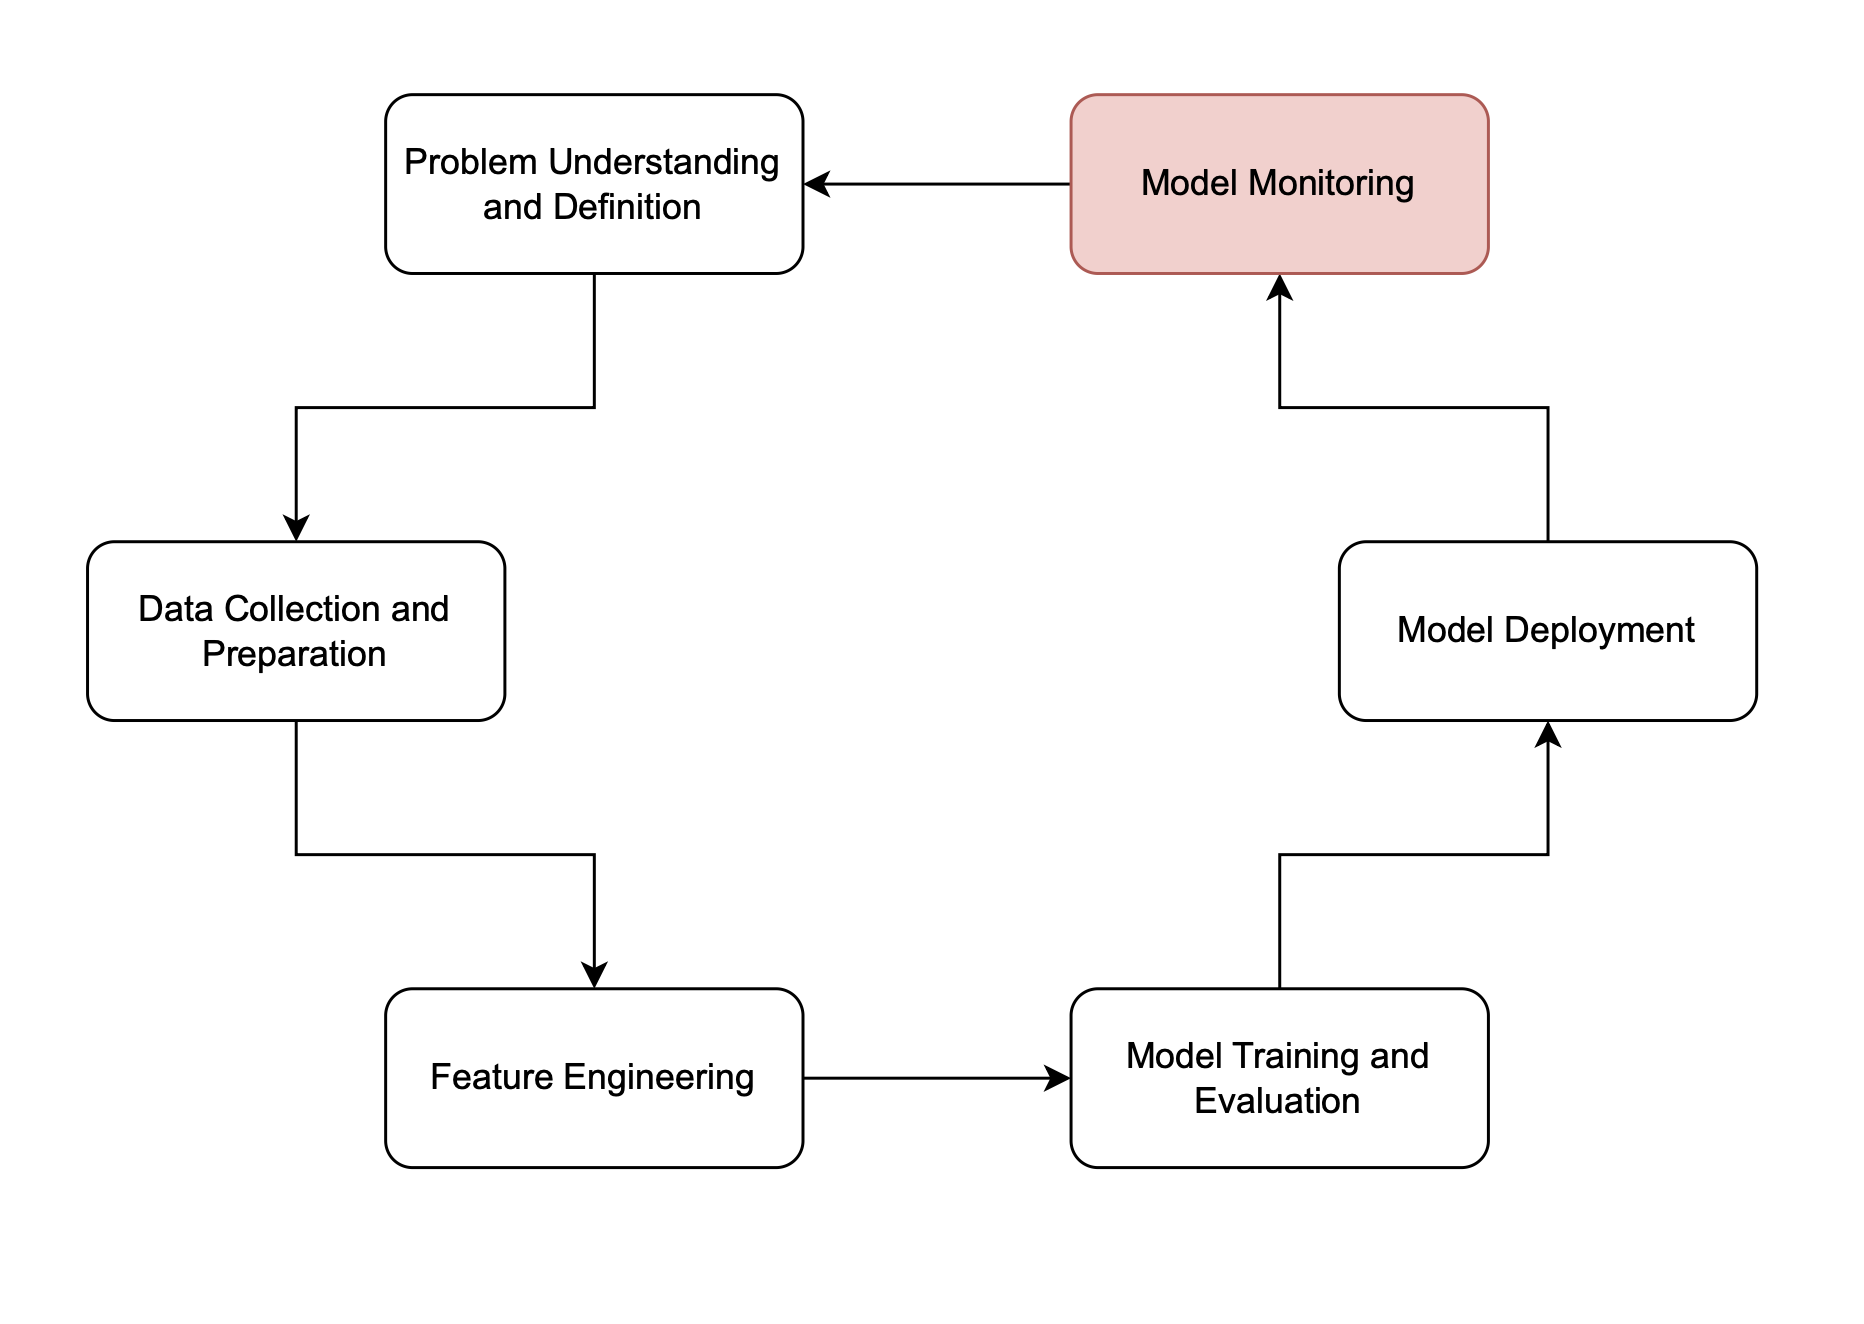
  • 训练、优化、部署、预测……接下来呢?
  • 监控
    • 记录日志
    • 可视化性能

机器学习生命周期中的监控阶段

端到端机器学习

使用 Python 记录日志

import logging
import matplotlib.pyplot as plt

# Setting up basic logging configuration
logging.basicConfig(filename='predictions.log', level=logging.INFO)

# Make predictions on the test set and log the results
for i in range(X_test.shape[0]):
    instance = X_test[i,:].reshape(1, -1)
    prediction = model.predict(instance)
    logging.info(f'Inst. {i} - PredClass: {prediction[0]}, RealClass: {y_test[i]}')
端到端机器学习

使用 Python 记录日志(续)

# Function to visualize the predictions from log
with open(logfile, 'r') as f:
    lines = f.readlines()
    predicted_classes = [int(line.split("Predicted Class: ")[1].split(",")[0]) \
        for line in lines]

    # Perform data analysis, visualization, etc.
    ...
  • 用 Python 日志追踪模型表现
端到端机器学习

可视化

  • 按时间检查性能
  • 将原始输入/预测数据转化为洞见
import matplotlib.pyplot as plt

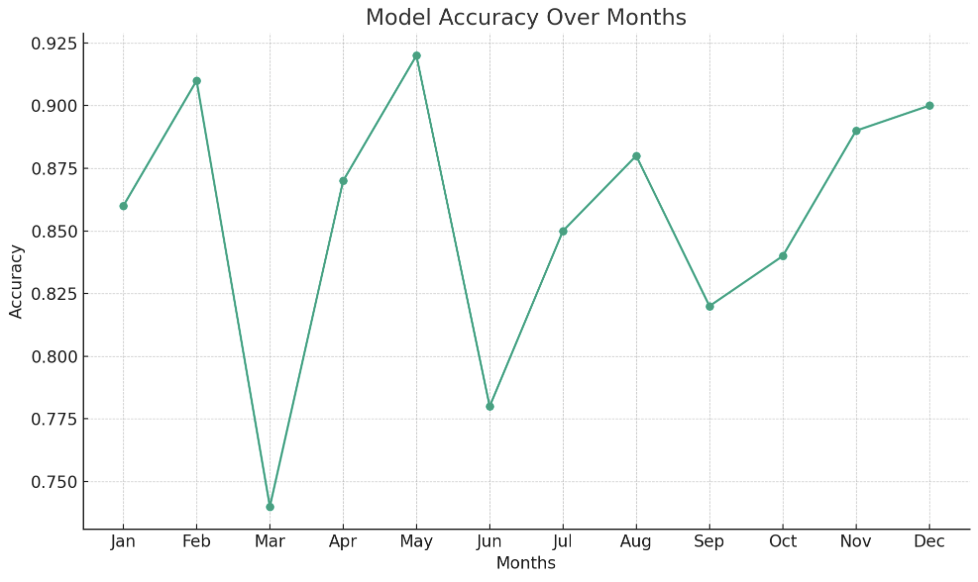
# Sample data: Random accuracy values for 12 months months = ["Jan", "Feb", "Mar", ...] accuracies = [0.86, 0.91, 0.74, ...]
plt.plot(months, accuracies, '-o') plt.title("Model Accuracy Over Months") plt.xlabel("Months") plt.ylabel("Accuracy") plt.show()
端到端机器学习

可视化示例

一张折线图,显示模型准确率在12个月内的变化

端到端机器学习

日志记录(Logging)

  • 事件记录

    • 变量值、函数调用跟踪
    • 支持执行与性能的信息
  • 监控可跟踪:

    • 使用情况、性能、错误/异常
2023-08-04 09:15:20 [INFO] Model version 1.2.7 started

2023-08-04 09:15:45 [INFO] Preprocessing input data for prediction
2023-08-04 09:15:47 [DEBUG] Input data shape: (1, 12)
2023-08-04 09:15:48 [INFO] Making prediction
2023-08-04 09:15:50 [DEBUG] Output prediction: [0.78]
...
端到端机器学习

可视化示例

  • 有用指标:随时间的平衡准确率
  • 发现趋势,检测性能下降
  • 判断是否需再训练
  • 选择契合用例的指标

示例:

  • 平衡准确率相对实际期望率变化
  • 可能提示问题
  • 选择并评估

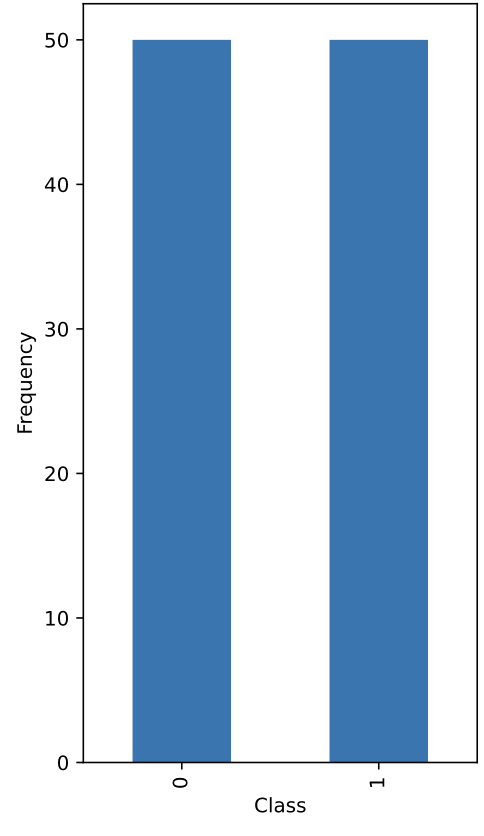
模型平衡准确率的可视化

端到端机器学习

¡Vamos a practicar!

端到端机器学习

Preparing Video For Download...