其他可视化工具
在 R 中可视化时间序列数据

Arnaud Amsellem
Quantitative Trader and creator of the R Trader blog
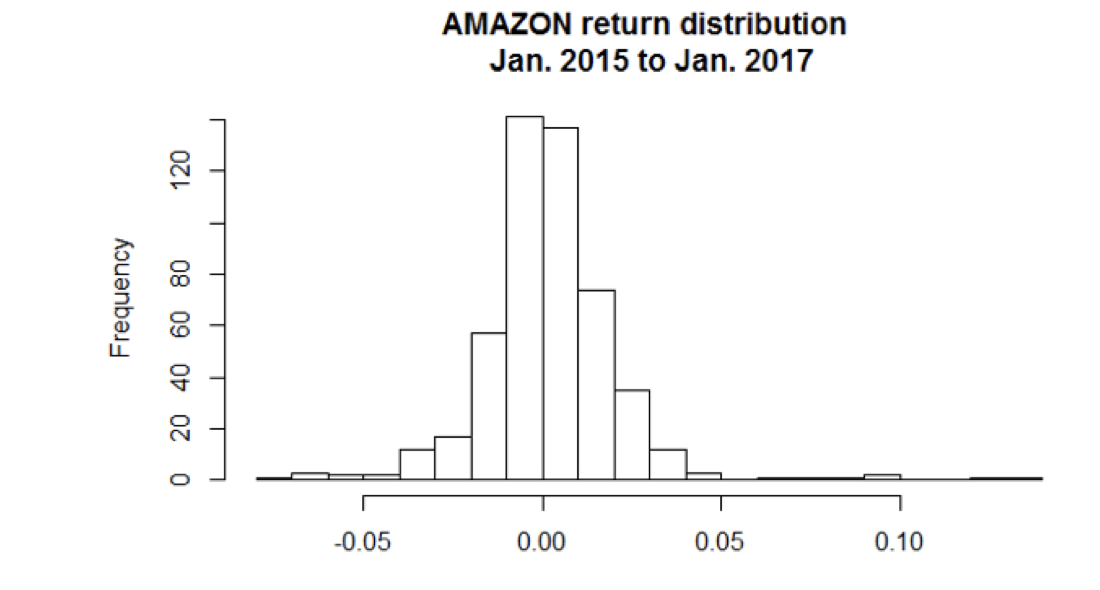
直方图
hist(amazon_stocks,
     breaks = 20,
     main = "AMAZON return distribution \
 Jan. 2015 to Jan. 2017",
     xlab = "")
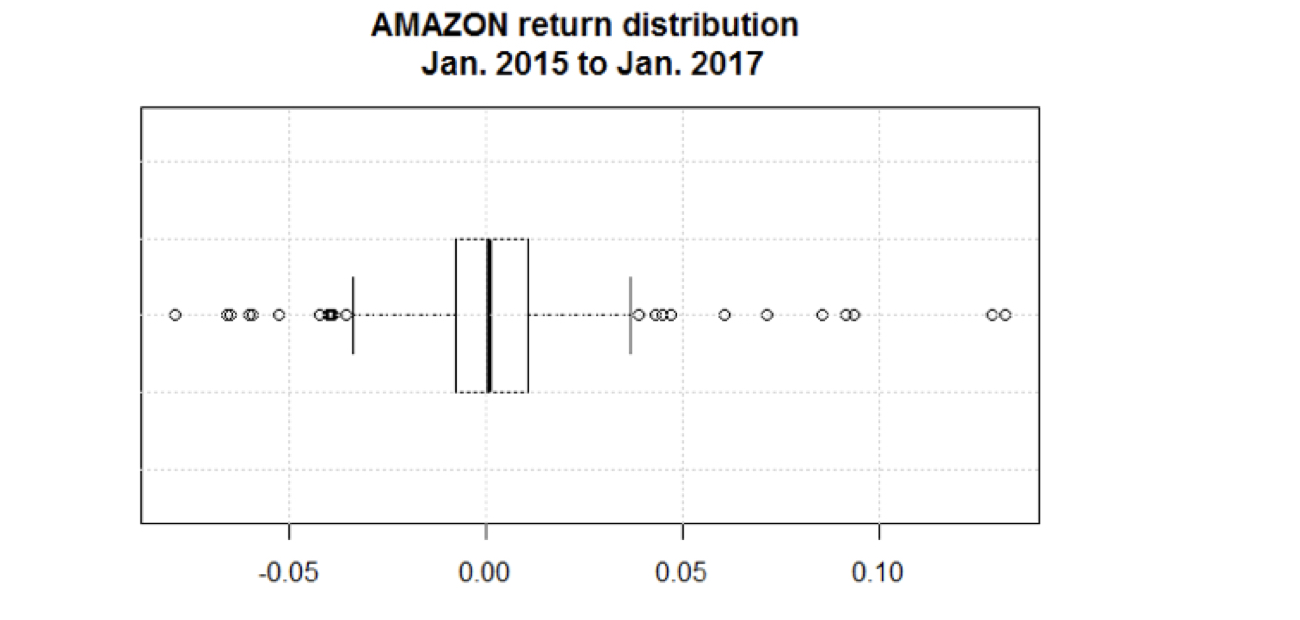
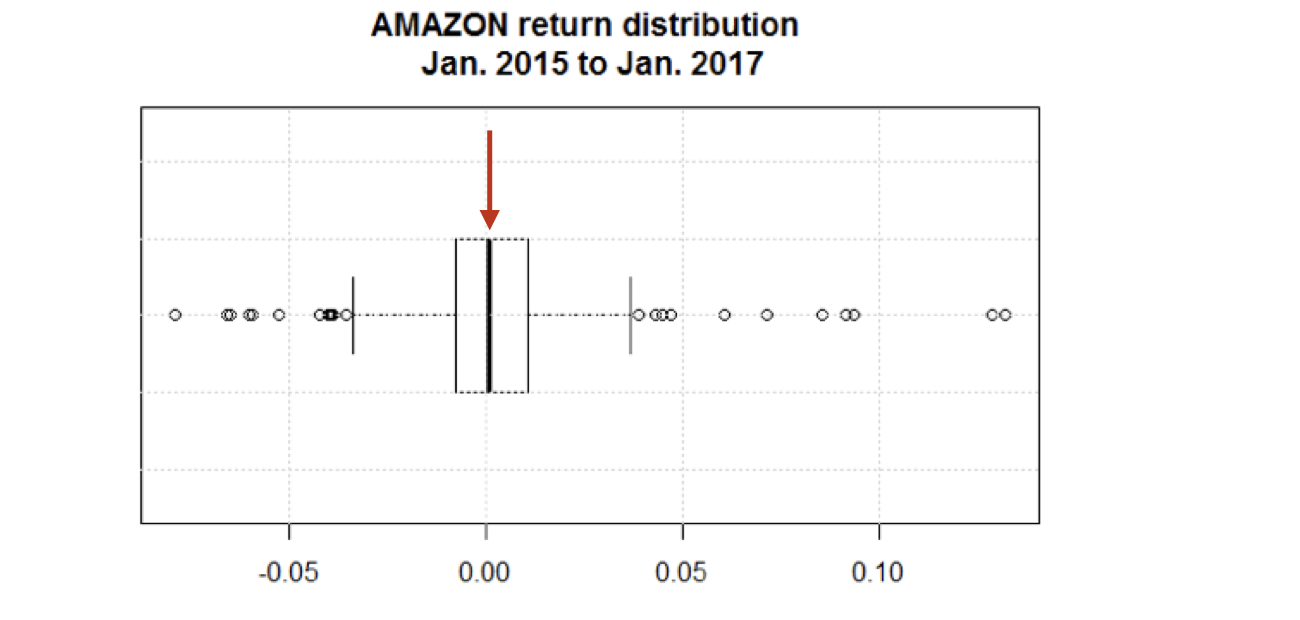
箱线图
boxplot(amazon_stocks,
horizontal = TRUE,
main = "AMAZON return distribution \
 Jan. 2015 to Jan. 2017")
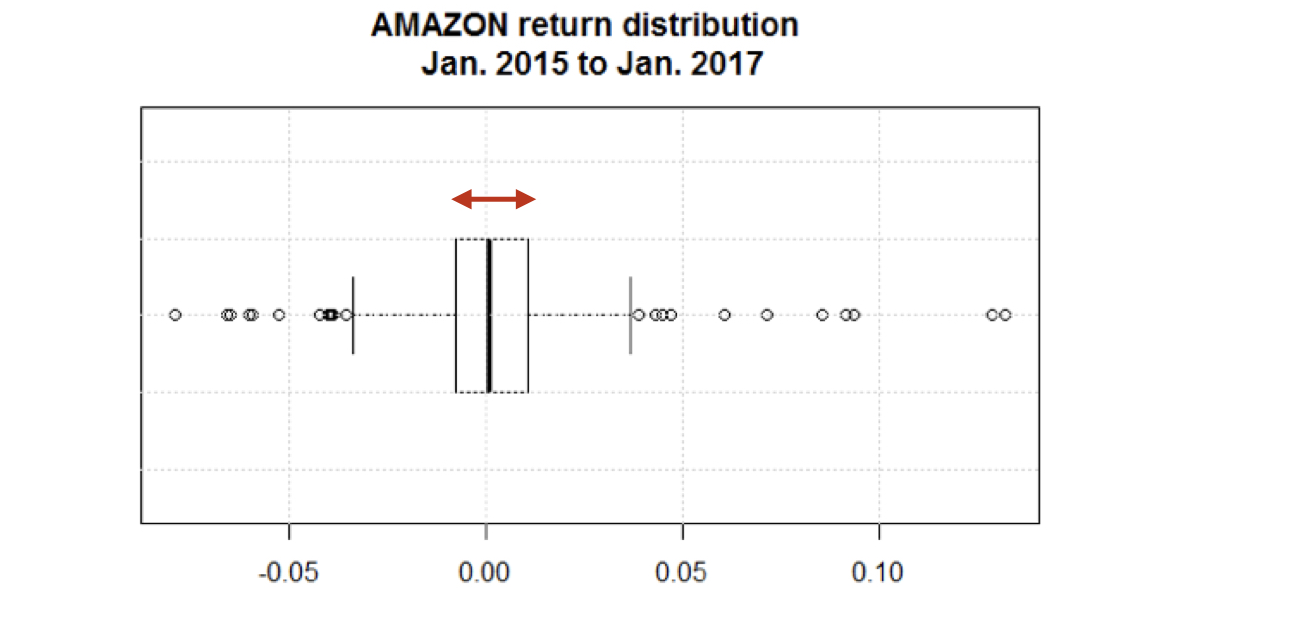
箱线图
boxplot(amazon_stocks,
horizontal = TRUE,
main = "AMAZON return distribution \
 Jan. 2015 to Jan. 2017")
箱线图
boxplot(amazon_stocks,
horizontal = TRUE,
main = "AMAZON return distribution \
 Jan. 2015 to Jan. 2017")
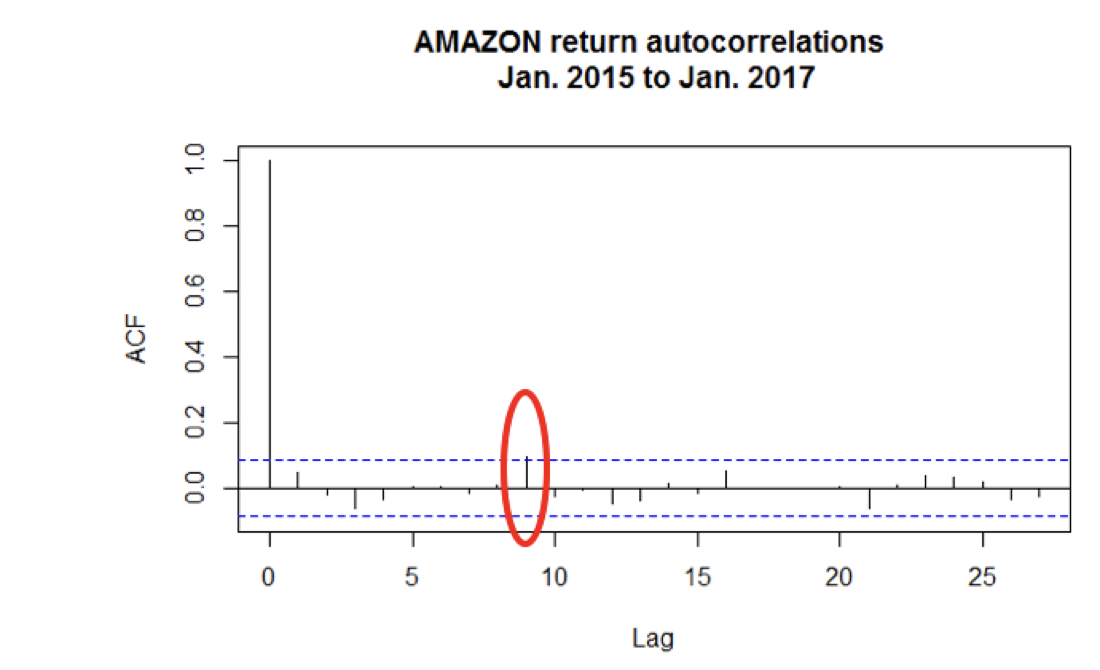
自相关
acf(amazon_stocks,
    main = "AMAZON return autocorrelations \
 Jan. 2015 to Jan. 2017")
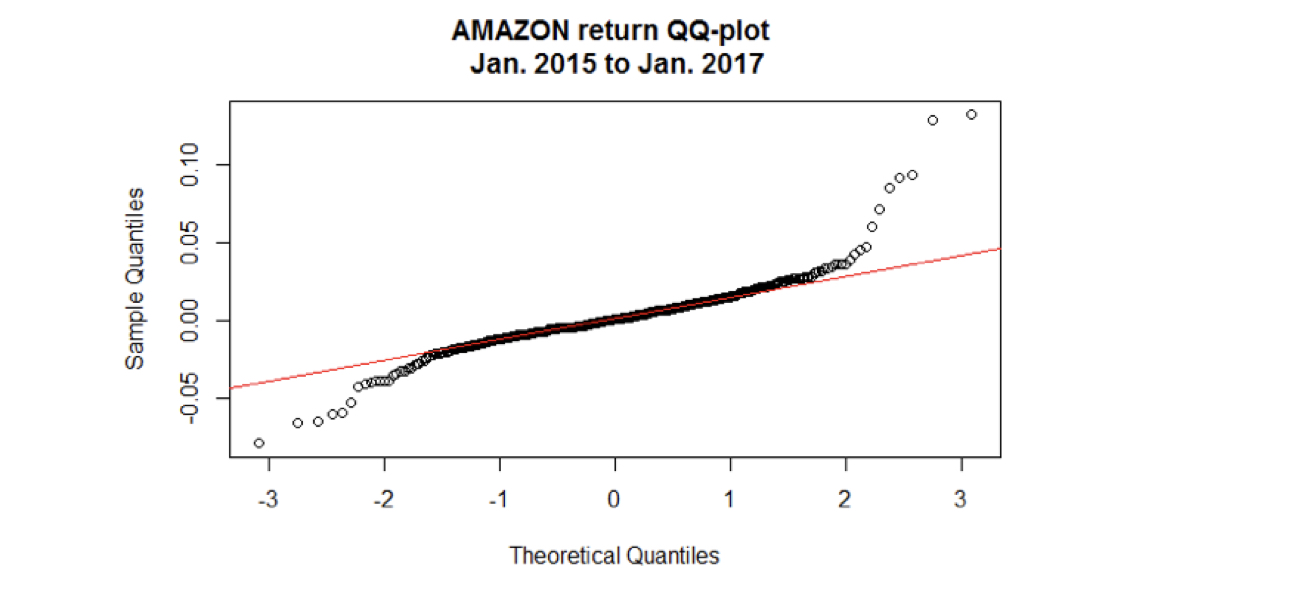
QQ 图
qqnorm(amazon_stocks,
       main = "AMAZON return QQ-plot \\n Jan. 2015 to Jan. 2017")
qqline(amazon_stocks,
       col = "red")