高维时间序列
在 R 中可视化时间序列数据

Arnaud Amsellem
Quantitative Trader and creator of the R Trader blog
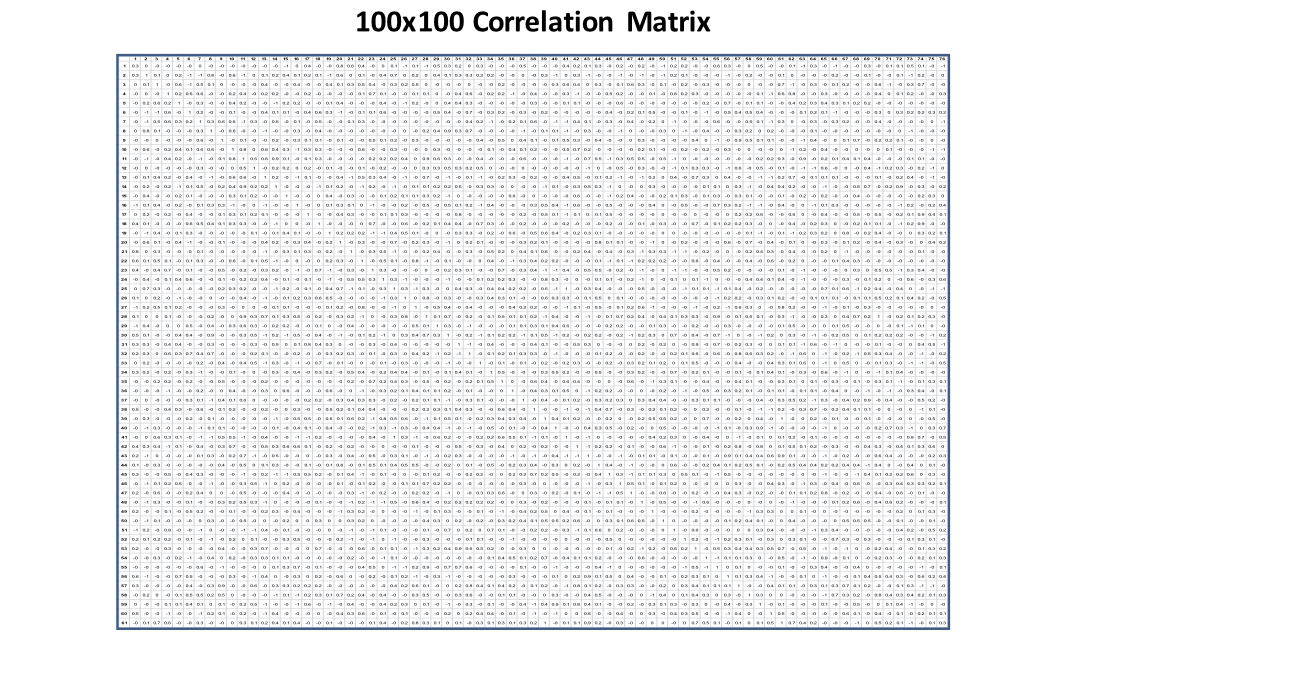
100 × 100 相关矩阵
cor_mat
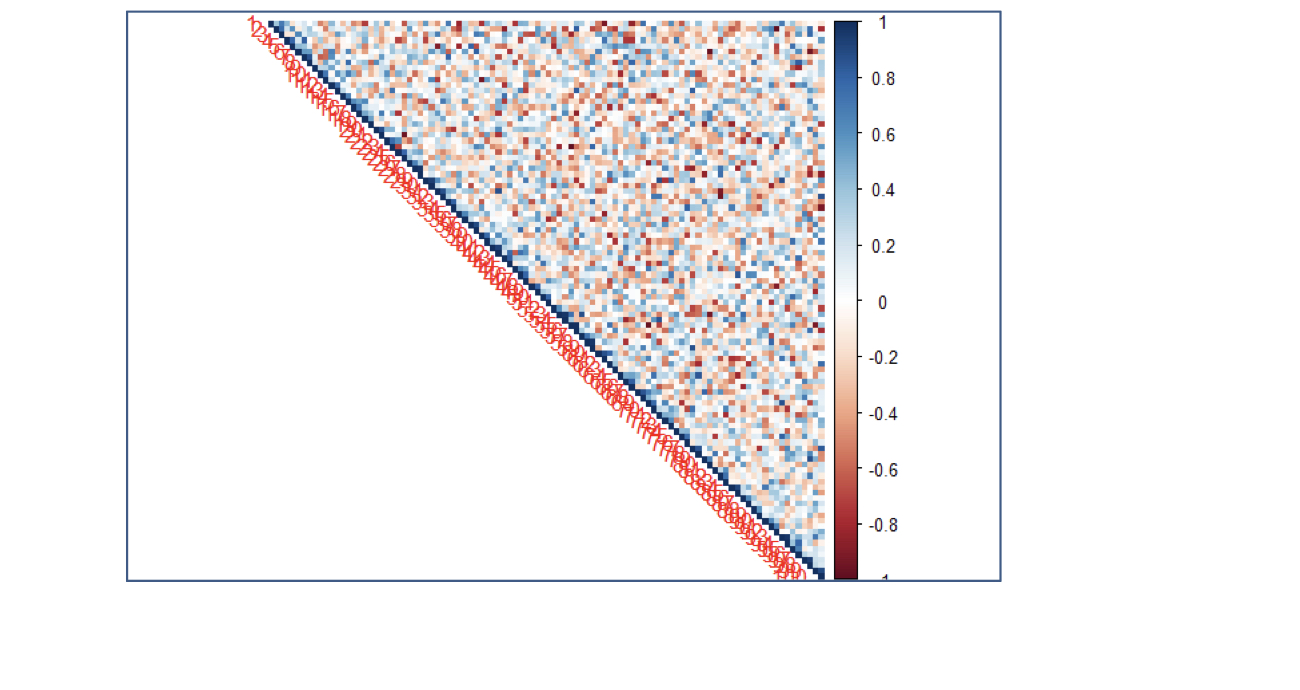
将相关矩阵绘为热图
corrplot(cor_mat, method = "color", type = "upper")
在 R 中可视化时间序列数据
Arnaud Amsellem
Quantitative Trader and creator of the R Trader blog
cor_mat
corrplot(cor_mat, method = "color", type = "upper")

