xts 与 plot() 函数回顾
在 R 中可视化时间序列数据

Arnaud Amsellem
Quantitative Trader and creator of the R Trader blog
xts 回顾
- 处理时间序列的特殊对象类
- eXtensible Time Series(可扩展时间序列)
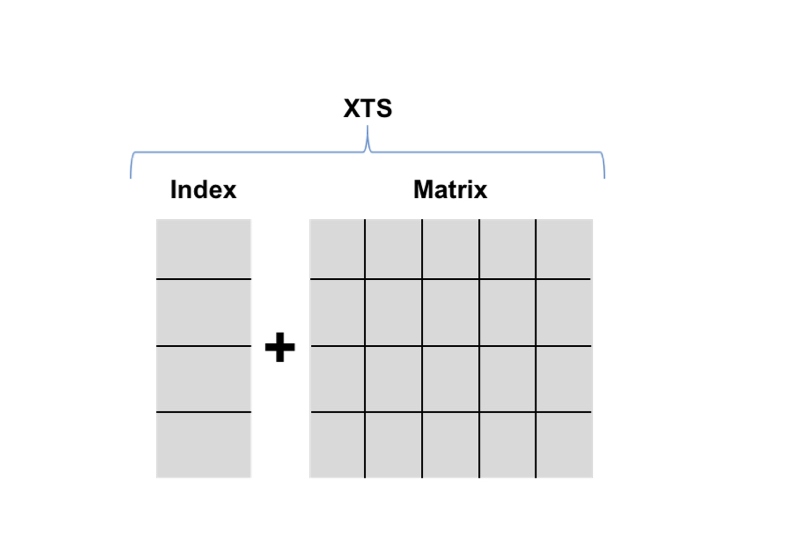
- xts = 时间索引 + 矩阵
- 索引是时间对象:
Date、POSIX Time、timeDate、chron
使用 plot() 函数
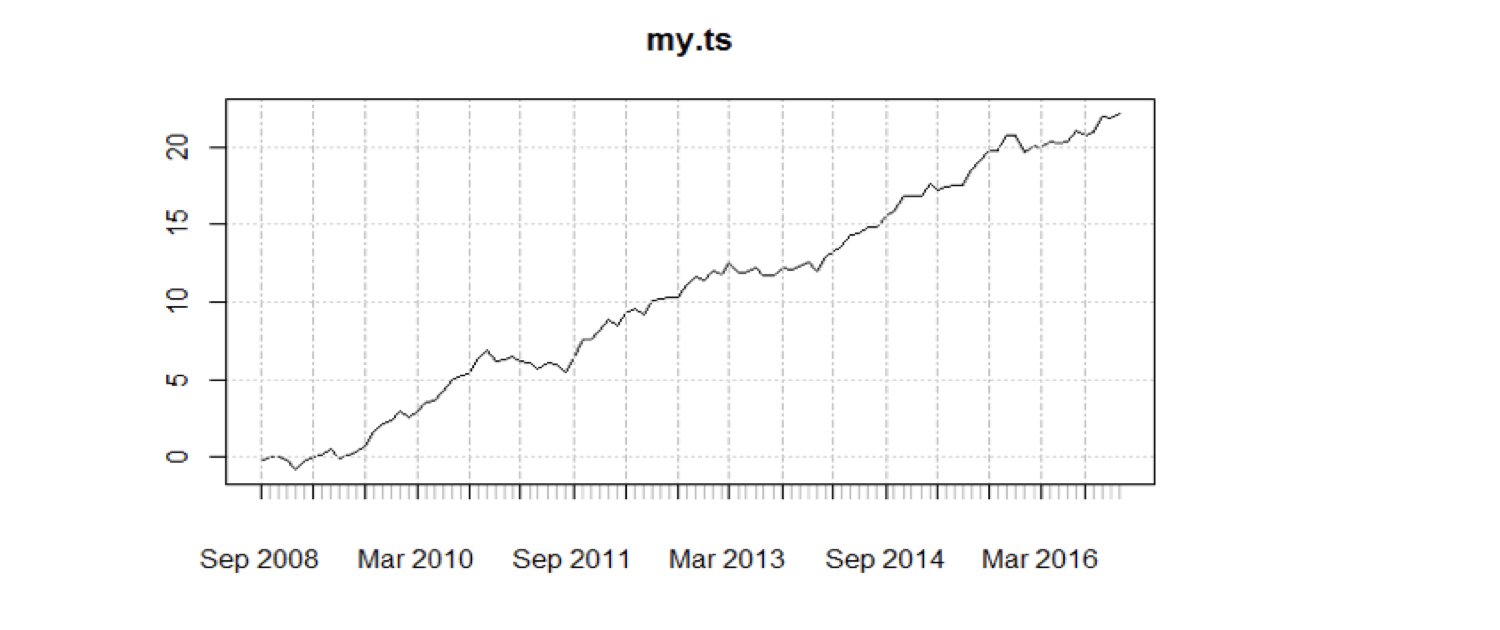
plot(my_ts)
使用 plot() 函数
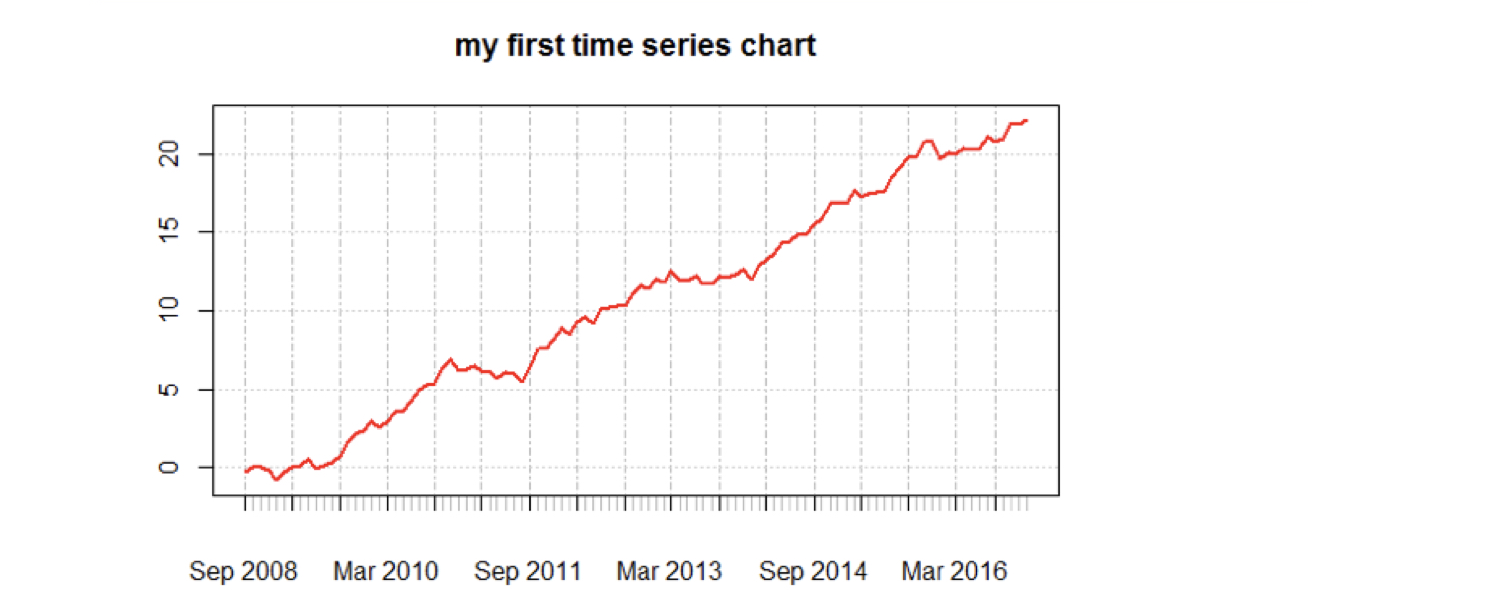
plot(my_ts, main = "my first time series")
lines(my_ts, col = "red", lwd = 2)
使用 plot() 函数
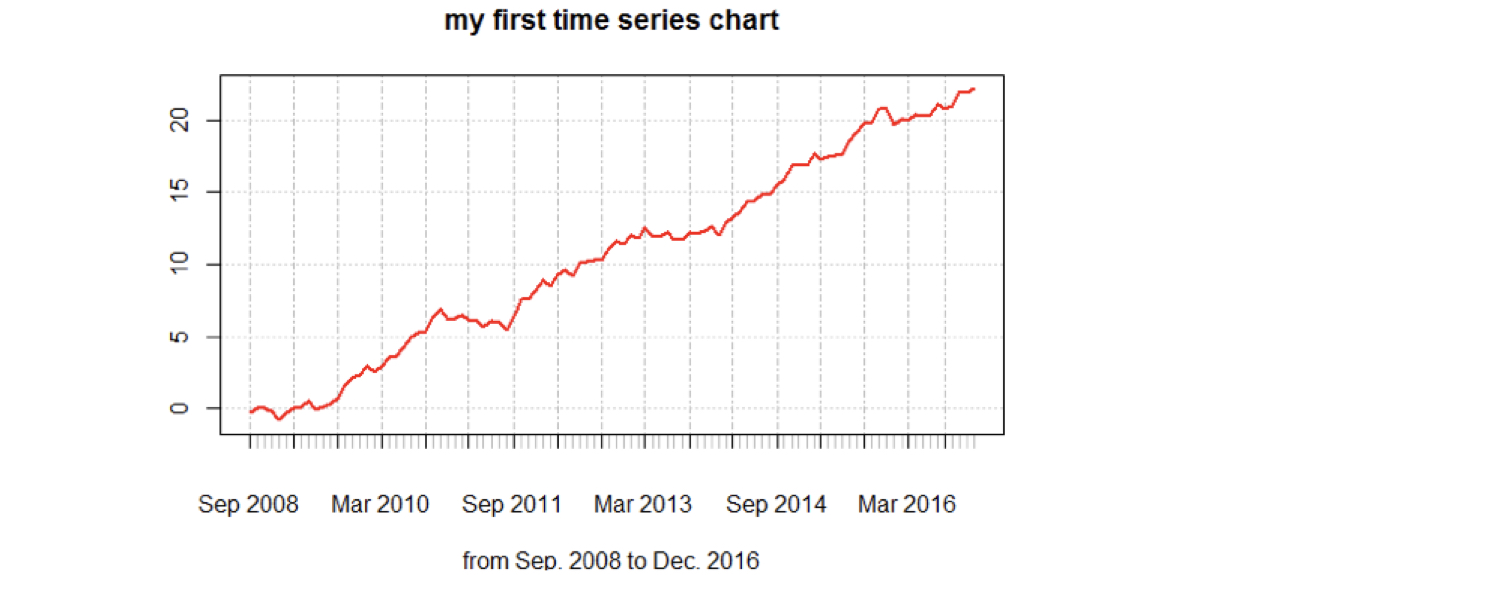
plot(my_ts, main = "my first time series",
            sub = "from Sep. 2008 to Dec. 2016")
lines(my_ts, col = "red", lwd = 2)

