图像数据

Python 中的生物医学图像分析

Stephen Bailey

Instructor

生物医学成像:一个多世纪的发现

$$1895$$

作者:Wilhelm Röntgen。- [1],公有领域,https://commons.wikimedia.org/w/index.php?curid=5059748

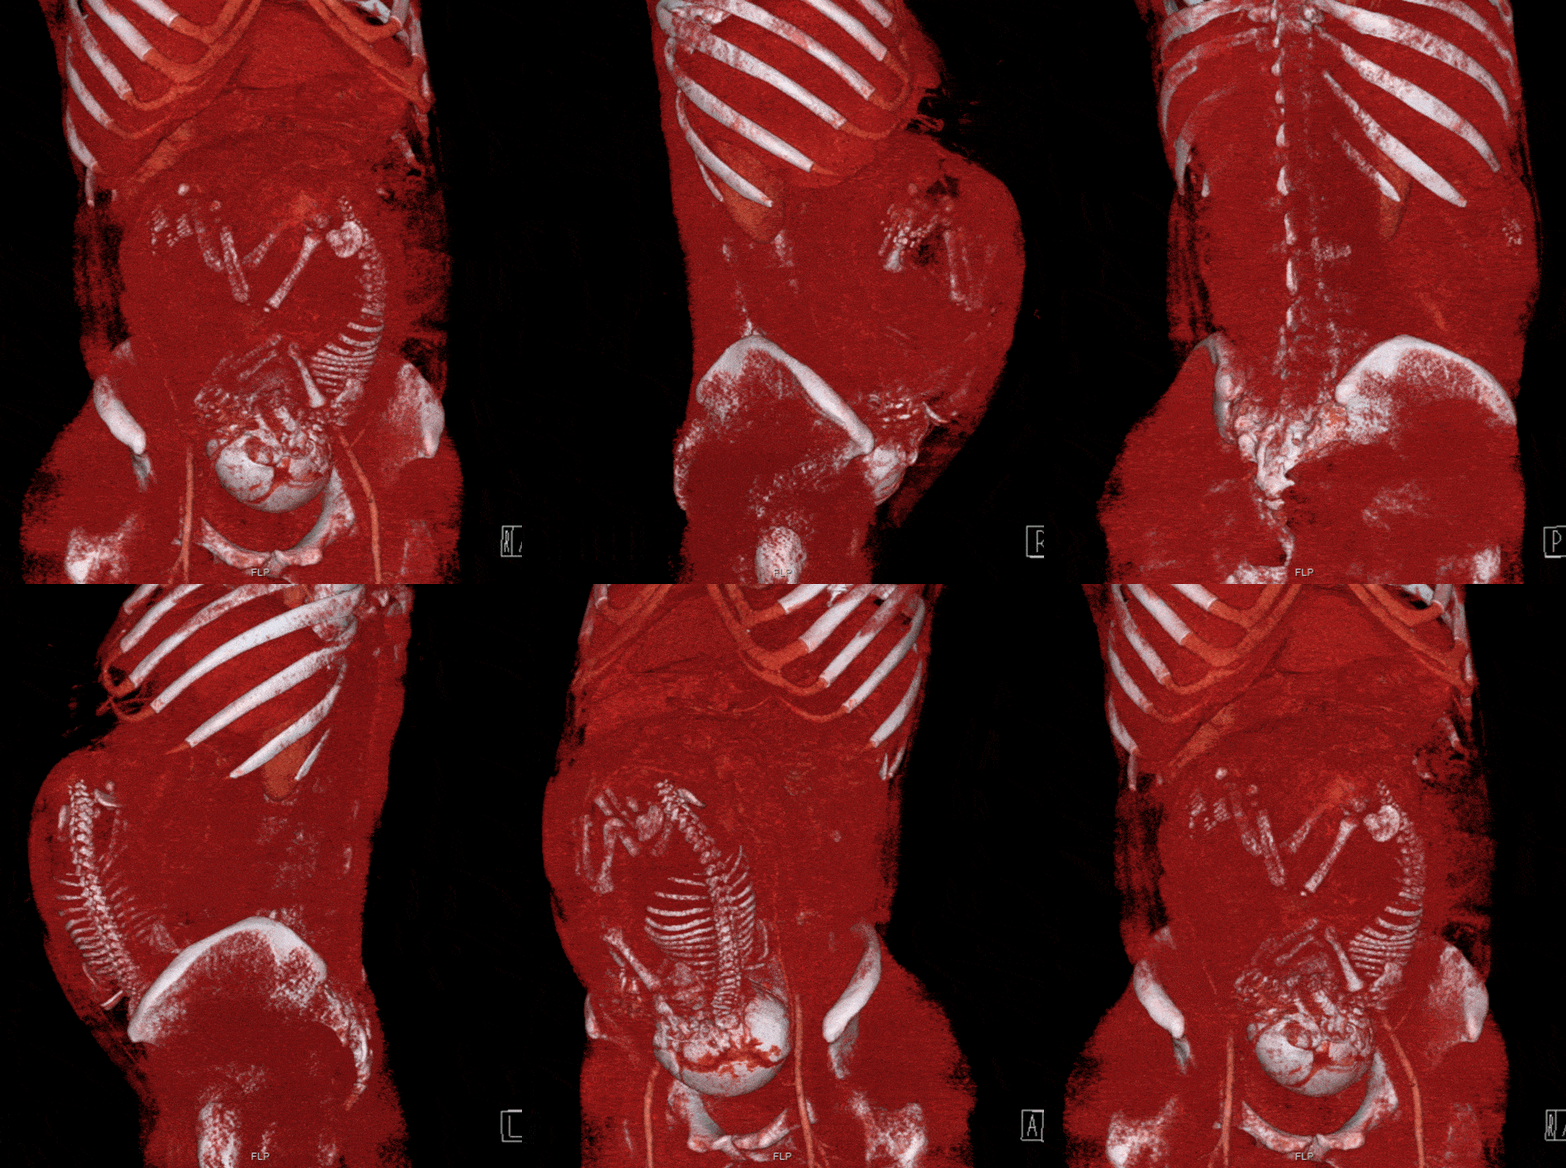
$$2017$$

作者:Mikael Häggström - 自制作品,CC0,https://commons.wikimedia.org/w/index.php?curid=61722886

Python 中的生物医学图像分析

课程目标

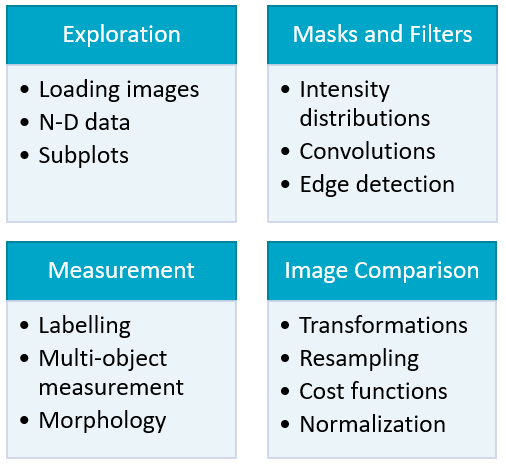
图像工作流

工具箱

  • ImageIO
  • NumPy
  • SciPy
  • matplotlib
Python 中的生物医学图像分析

加载图像

  • imageio:读取与保存图像
  • Image 对象是 NumPy 数组。
import imageio.v2 as imageio
im = imageio.imread('body-001.dcm')

type(im)
imageio.core.Image
im
Image([[125, 135, ..., 110],
       [100, 130, ..., 100],
        ...,
       [100, 150, ..., 100]], 
          dtype=uint8)
Python 中的生物医学图像分析

加载图像

  • 通过为各维度指定索引来切片数组。
im[0, 0]
125
im[0:2, 0:2]
Image([[125, 135],
       [100, 130]], 
       dtype=uint8)
Python 中的生物医学图像分析

元数据

  • 元数据:获取图像的时间、方式、对象等信息

  • 可通过 Image 对象的 meta 字典属性访问

im.meta
im.meta['Modality']
im.meta.keys()
Dict([('StudyDate', '2017-01-01'),
      ('Modality', 'MR'),
      ('PatientSex', F),
      ...
      ('shape', (256, 256)])
'MR'
odict_keys(['StudyDate', 
            'SeriesDate', 
            'PatientSex',
             ...
             'shape'])
Python 中的生物医学图像分析

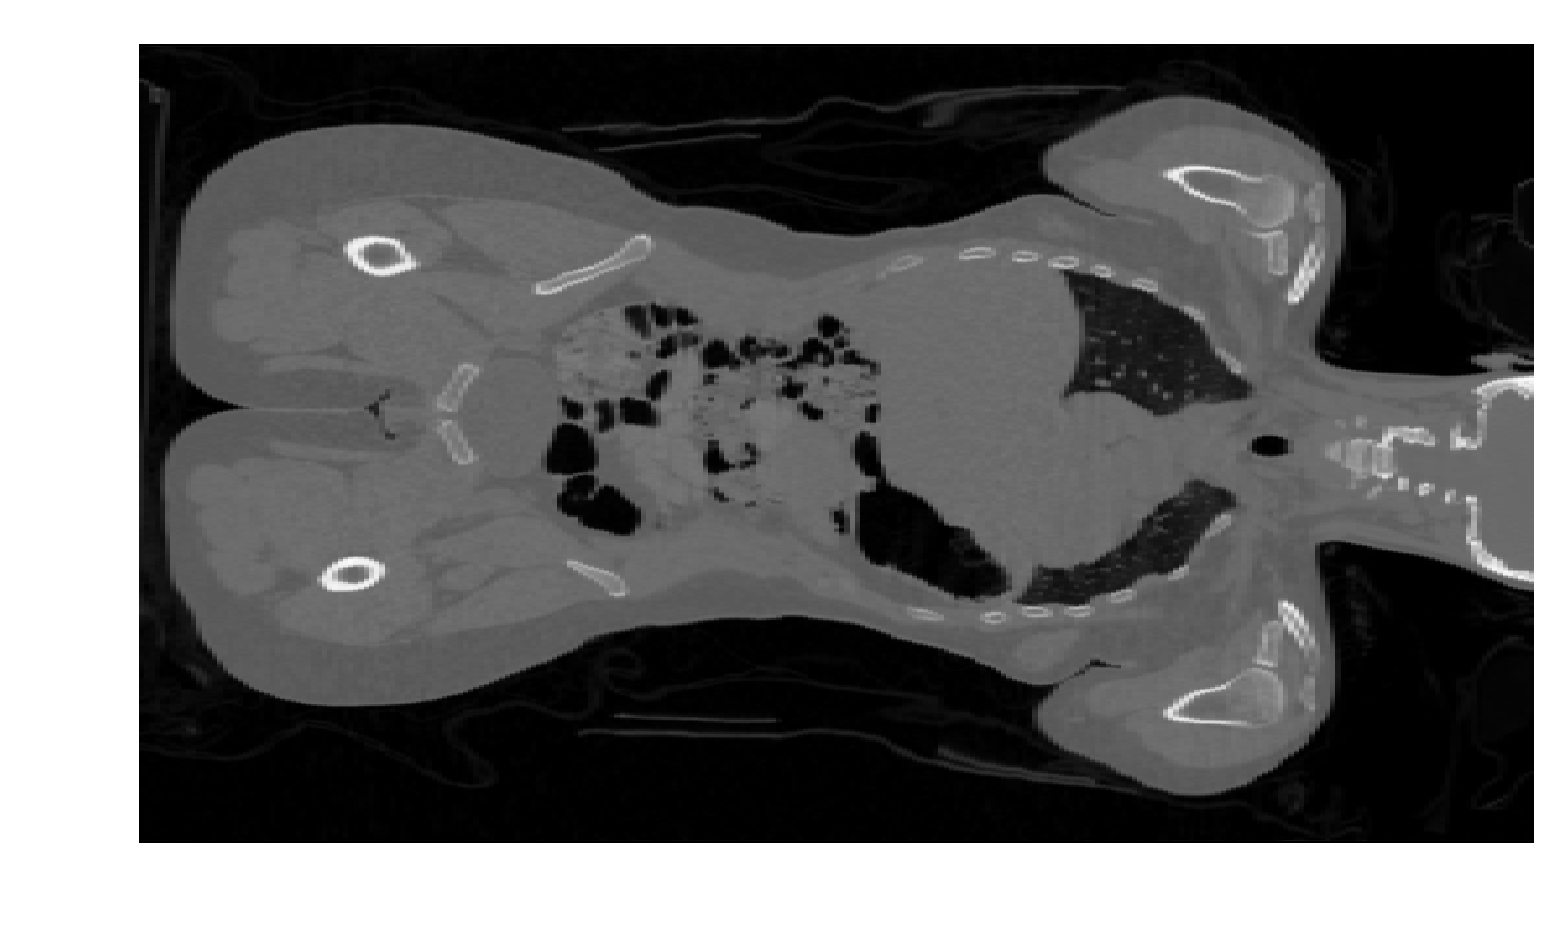
绘制图像

  • Matplotlib 的 imshow() 用于显示二维图像数据

  • 提供多种色图,但常用灰度图(cmap='gray'

  • 轴刻度和标签对图像通常无用

import matplotlib.pyplot as plt

plt.imshow(im, cmap='gray')
plt.axis('off')
plt.show()

冠状位切片

Python 中的生物医学图像分析

让我们练习吧!

Python 中的生物医学图像分析

Preparing Video For Download...