测量强度

Python 中的生物医学图像分析

Stephen Bailey

Instructor

测量强度
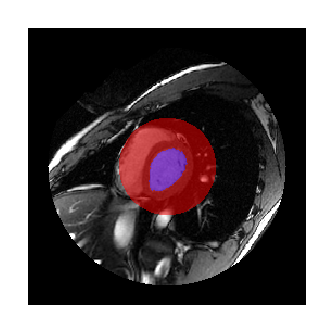
对一帧心脏时间序列,我们有以下标签:

  1. 左心室
  2. 中央部分

带标签的二维心脏图像

Python 中的生物医学图像分析

函数

scipy.ndimage.measurements


ndi.mean()

ndi.median()

ndi.sum()

ndi.maximum()

ndi.standard_deviation()

ndi.variance()

函数可在所有维度上应用,可选按特定标签。

自定义函数:

ndi.labeled_comprehension()

Python 中的生物医学图像分析

调用测量函数

import imageio.v2 as imageio
import scipy.ndimage as ndi
vol=imageio.volread('SCD-3d.npz')
label=imageio.volread('labels.npz')

# 所有像素 ndi.mean(vol)
3.7892
# 有标签的像素
ndi.mean(vol, label)
89.2342
# 标签 1
ndi.mean(vol, label, index=1)
163.2930
# 标签 1 和 2
ndi.mean(vol, label, index=[1,2])
[163.2930, 60.2847]
Python 中的生物医学图像分析

对象直方图

hist=ndi.histogram(vol, min=0, max=255, bins=256)

obj_hists=ndi.histogram(vol, 0, 255, 256, labels, index=[1, 2]) len(obj_hists)
2
Python 中的生物医学图像分析

对象直方图

plt.plot(obj_hists[0], 
   label='Left ventricle')
plt.plot(obj_hists[1], 
   label='Other labelled pixels')
plt.legend()
plt.show()
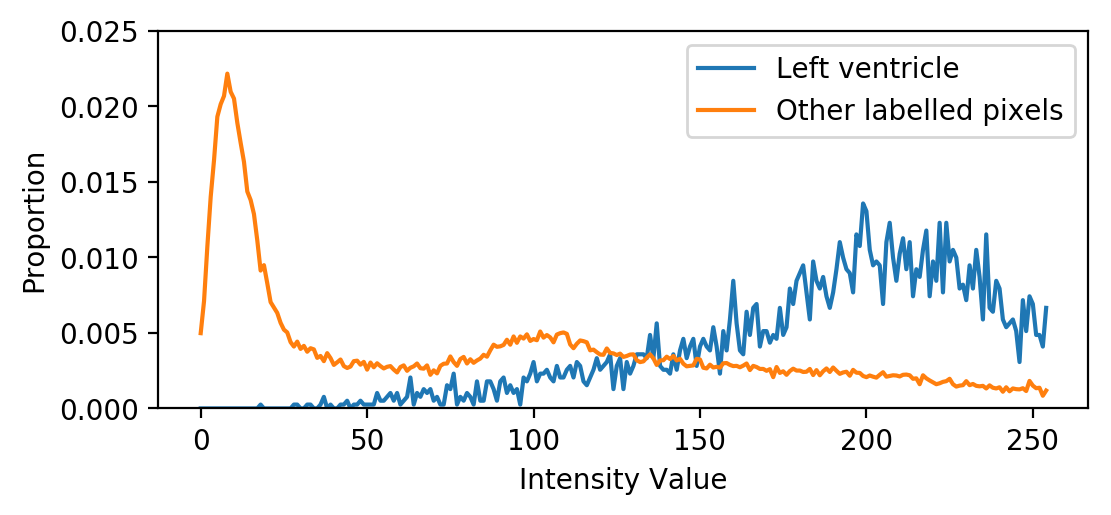
histograms-plot

  • 含多种组织的直方图会出现多个峰值

  • 良好分割的组织,其直方图常近似正态分布

Python 中的生物医学图像分析

Passons à la pratique !

Python 中的生物医学图像分析

Preparing Video For Download...