使用 Dash 和 Plotly 构建仪表板
Alex Scriven
Data Scientist
$$
# 创建图形与布局
   dcc.Graph(id='bar_fig',
             figure=ecom_bar),

   html.Br(),
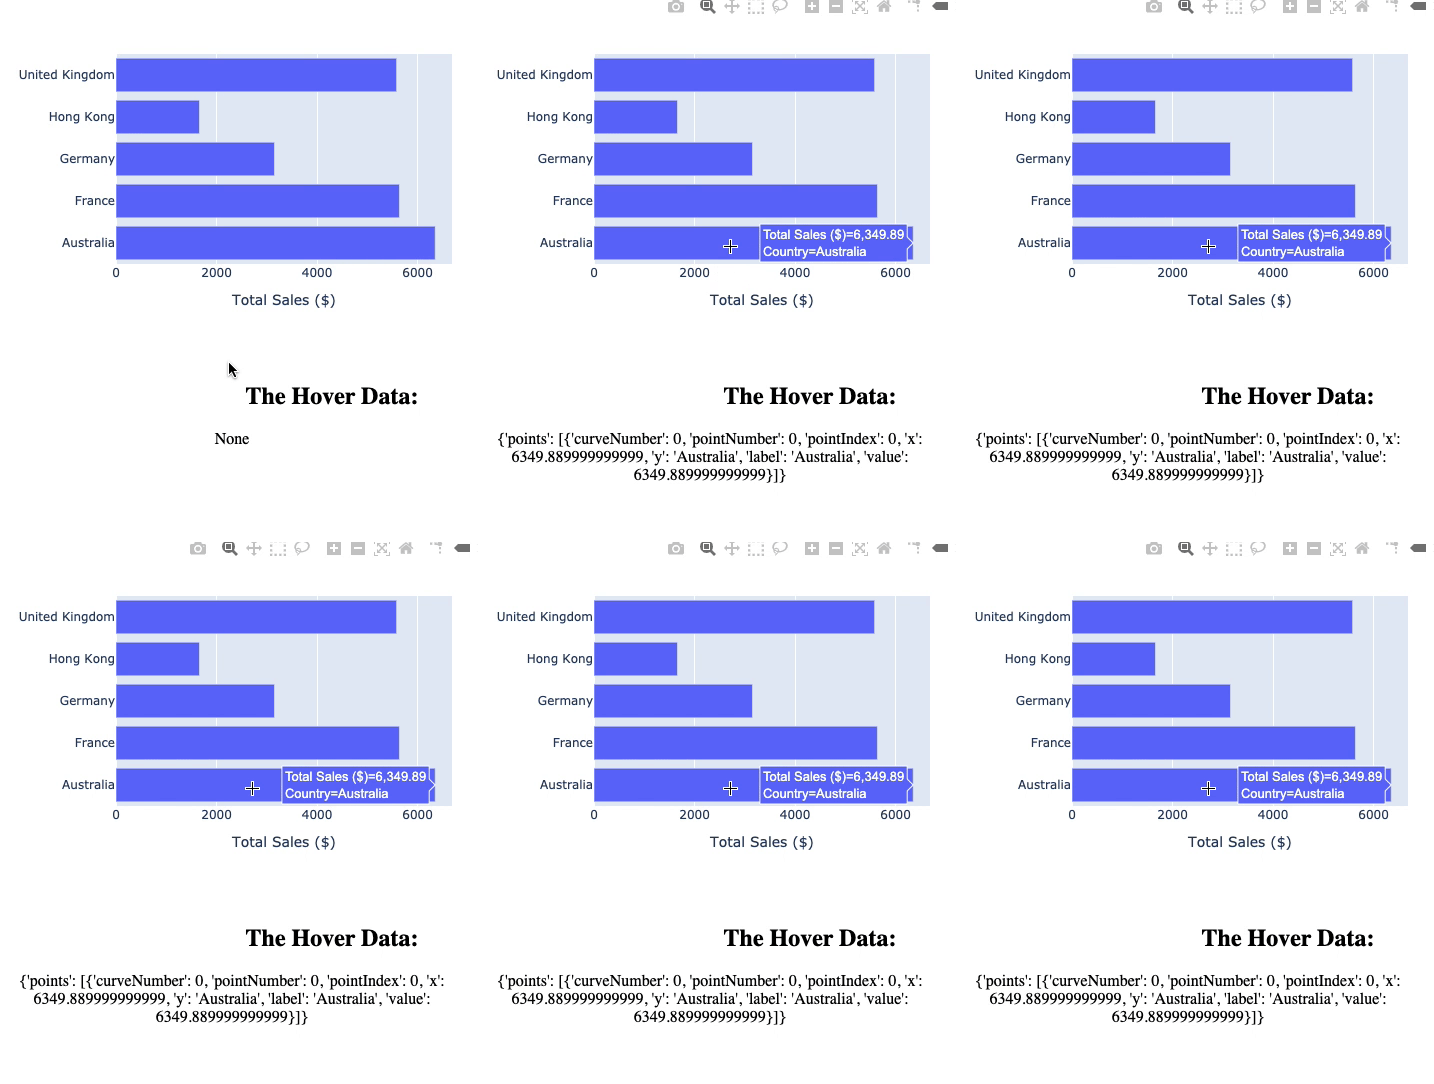
   html.H2("The Hover Data:"),
   html.P(id='text_output')
# 创建图形与布局 dcc.Graph(id='bar_fig', figure=ecom_bar),
html.Br(), html.H2("The Hover Data:"), html.P(id='text_output')
# 设置回调
@callback(
    Output('text_output', 'children'),
    Input('bar_fig', 'hoverData'))

def capture_hover_data(hoverData):
    return str(hoverData)
# 设置回调 @callback( Output('text_output', 'children'), Input('bar_fig', 'hoverData'))
def capture_hover_data(hoverData): return str(hoverData)
发生了什么:
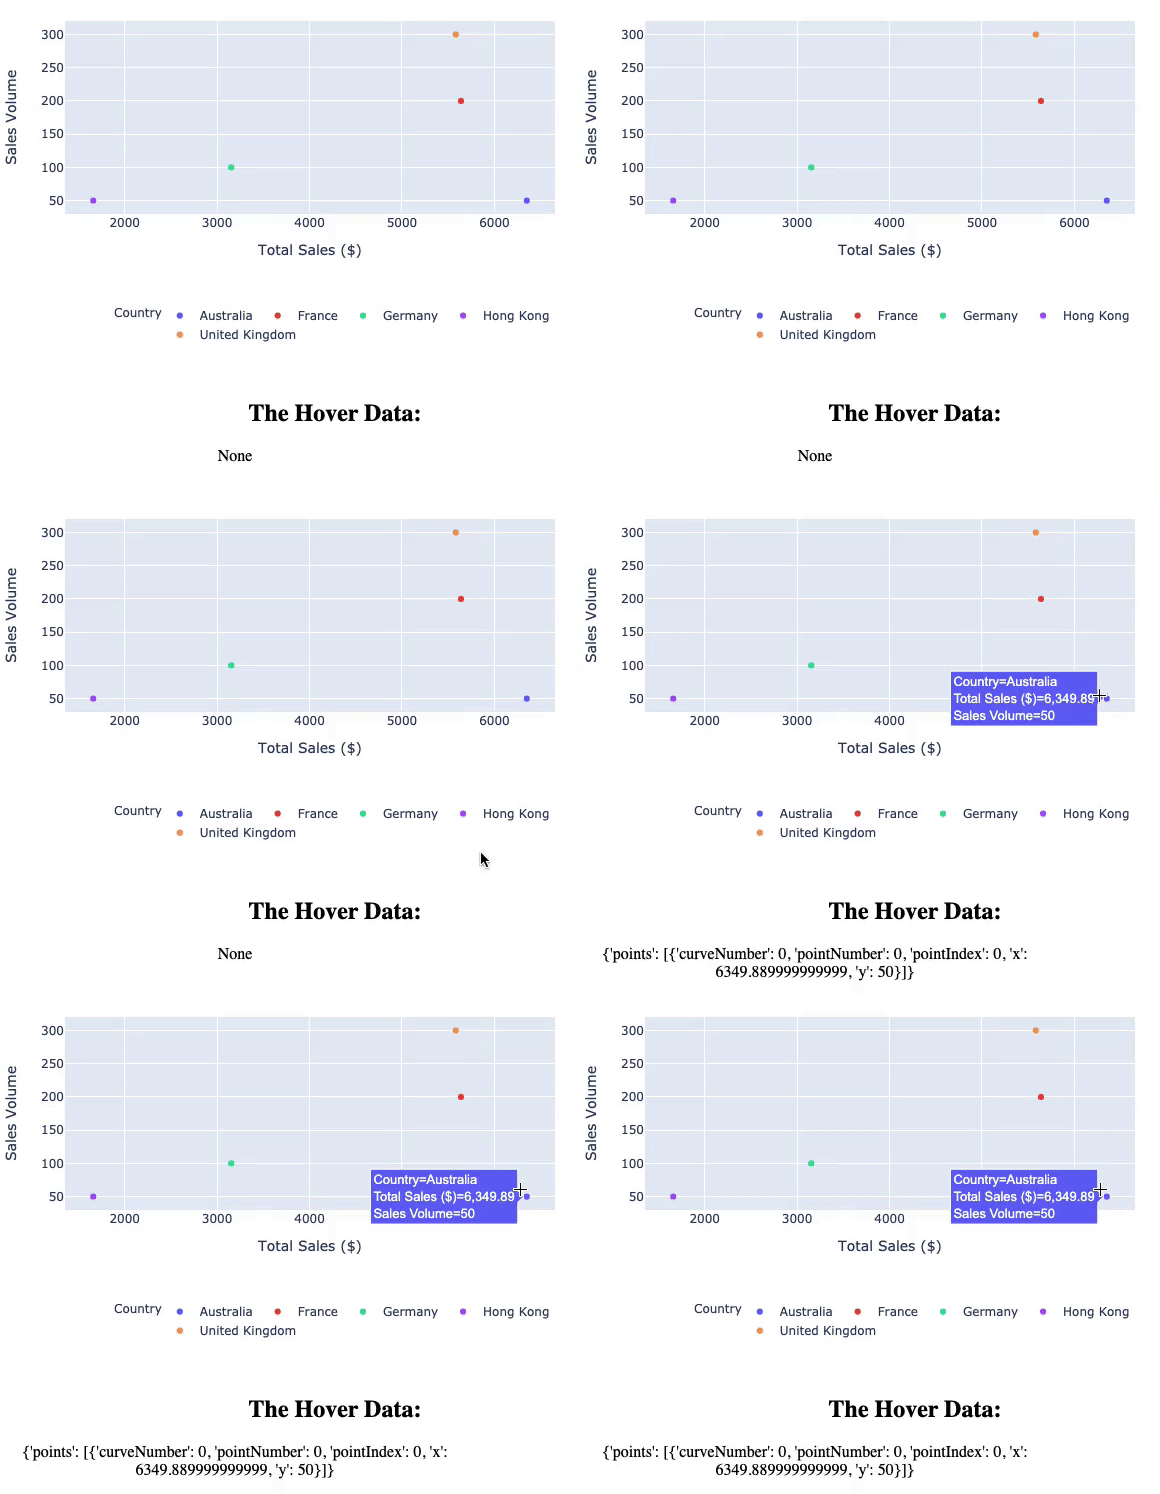
hoverData
.P()
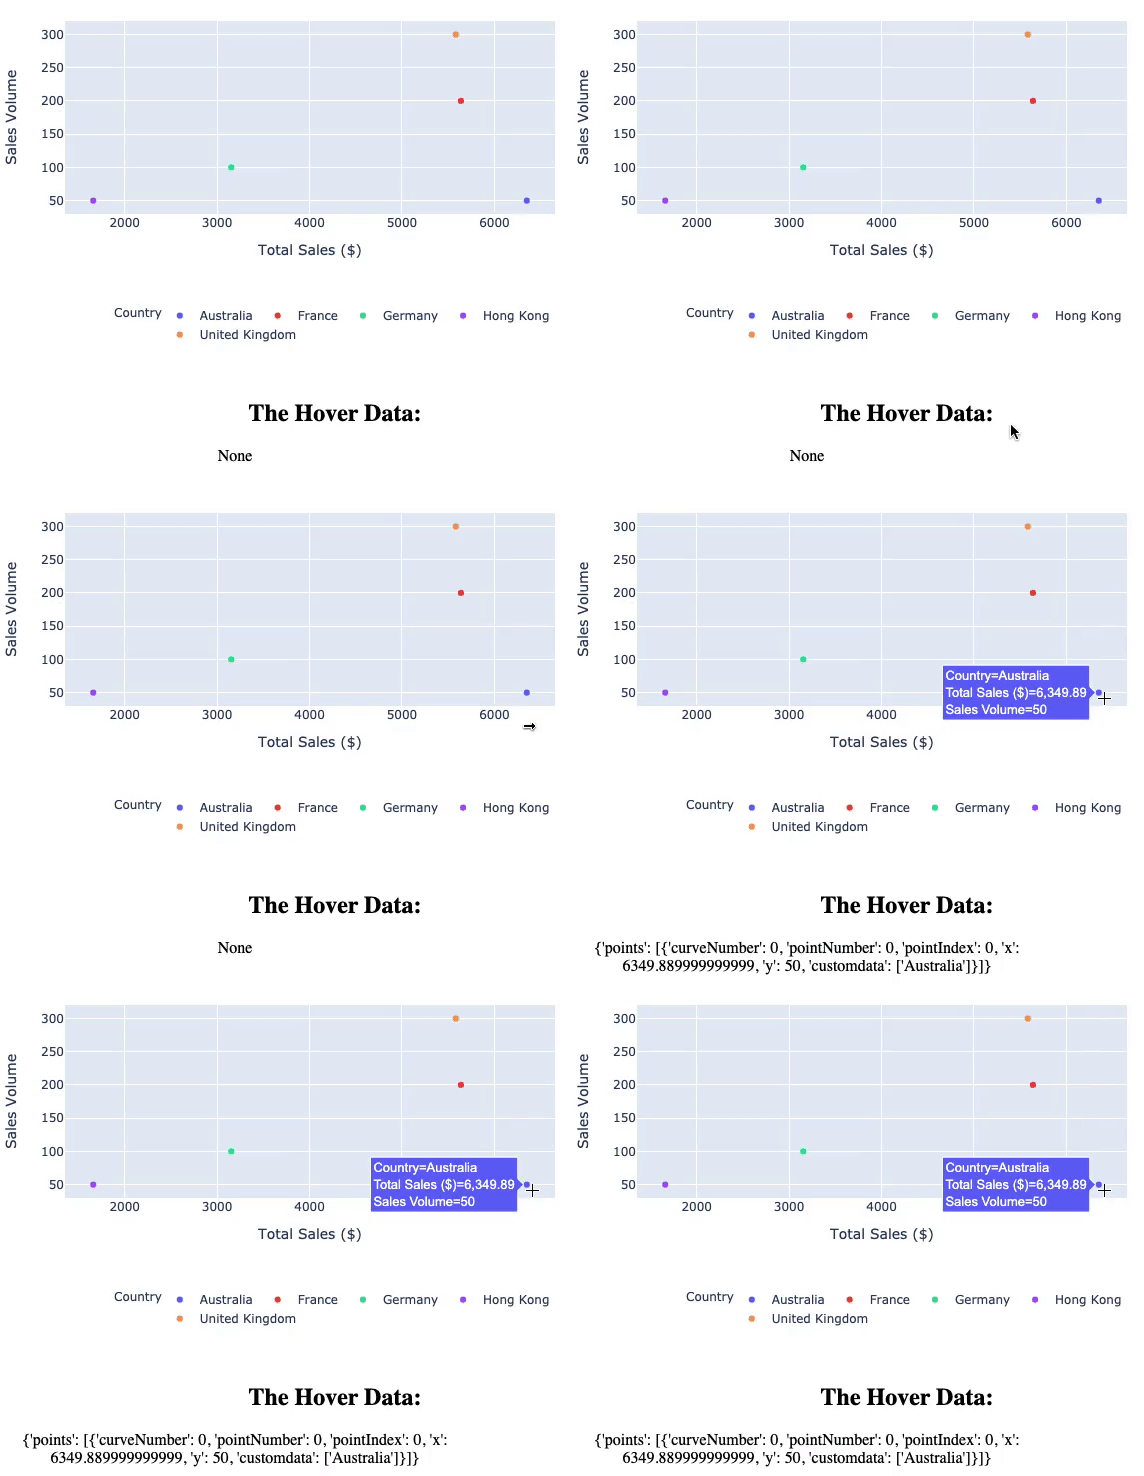
ecom_scatter = px.scatter(ecom_data,
    x='Total Sales ($)',
    y='Sales Volume', color='Country',
    custom_data=['Country'])
customData
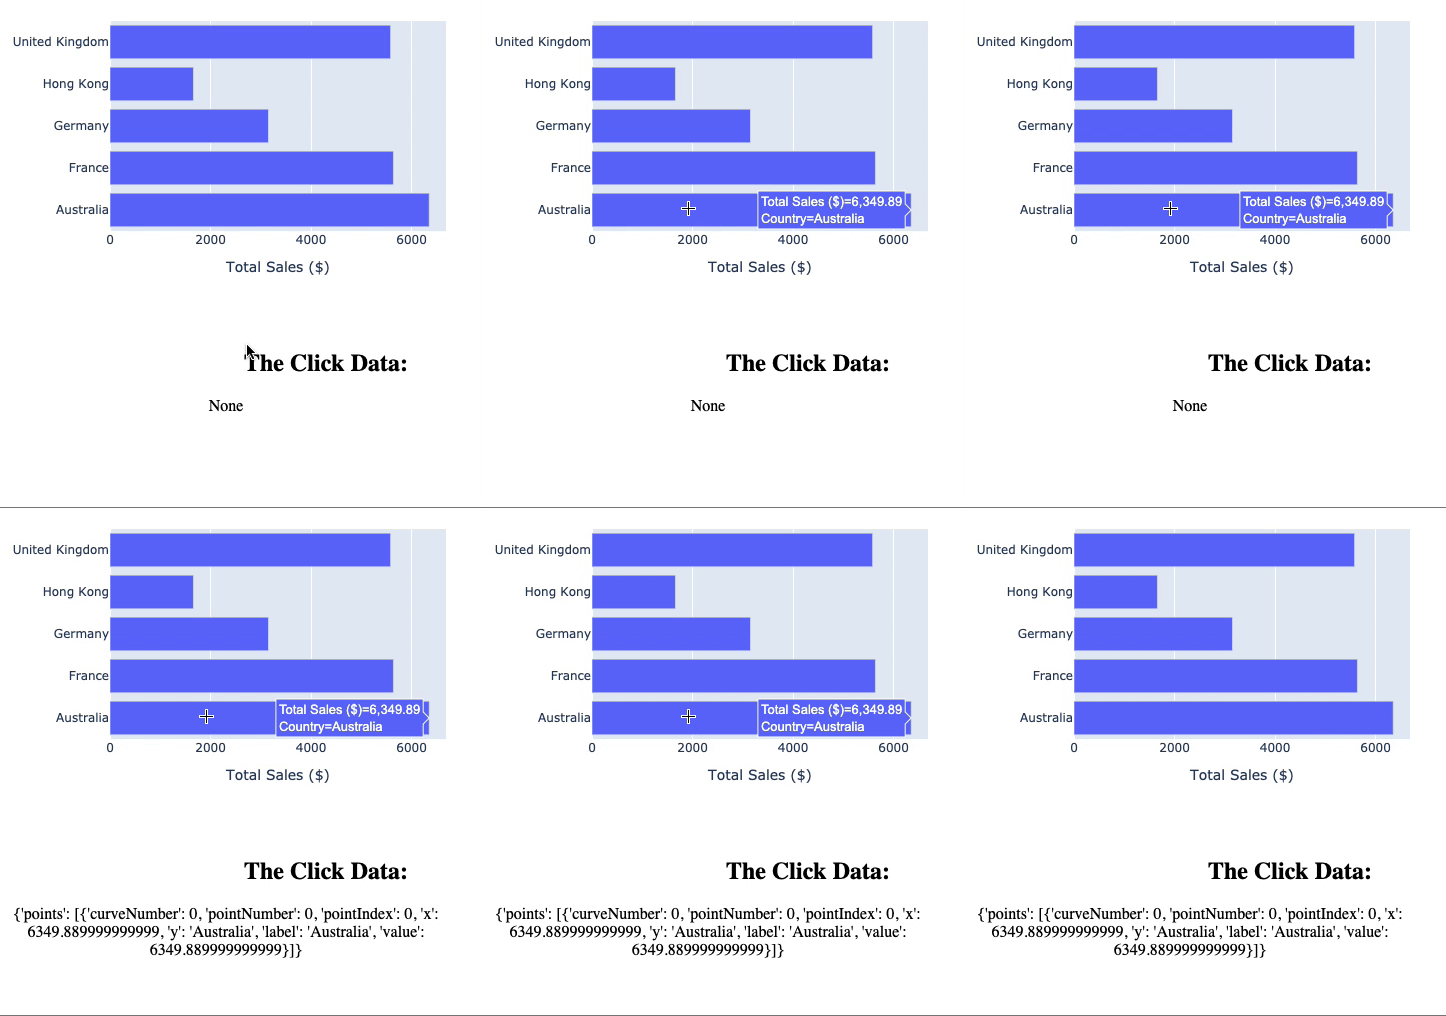
clickData
@callback(
    Output('text_output', 'children'),
    Input('bar_fig', 'clickData'))
def capture_hover_data(clickData):
    return str(clickData)