从 Plotly 到 Dash
使用 Dash 和 Plotly 构建仪表板

Alex Scriven
Data Scientist
我们的应用
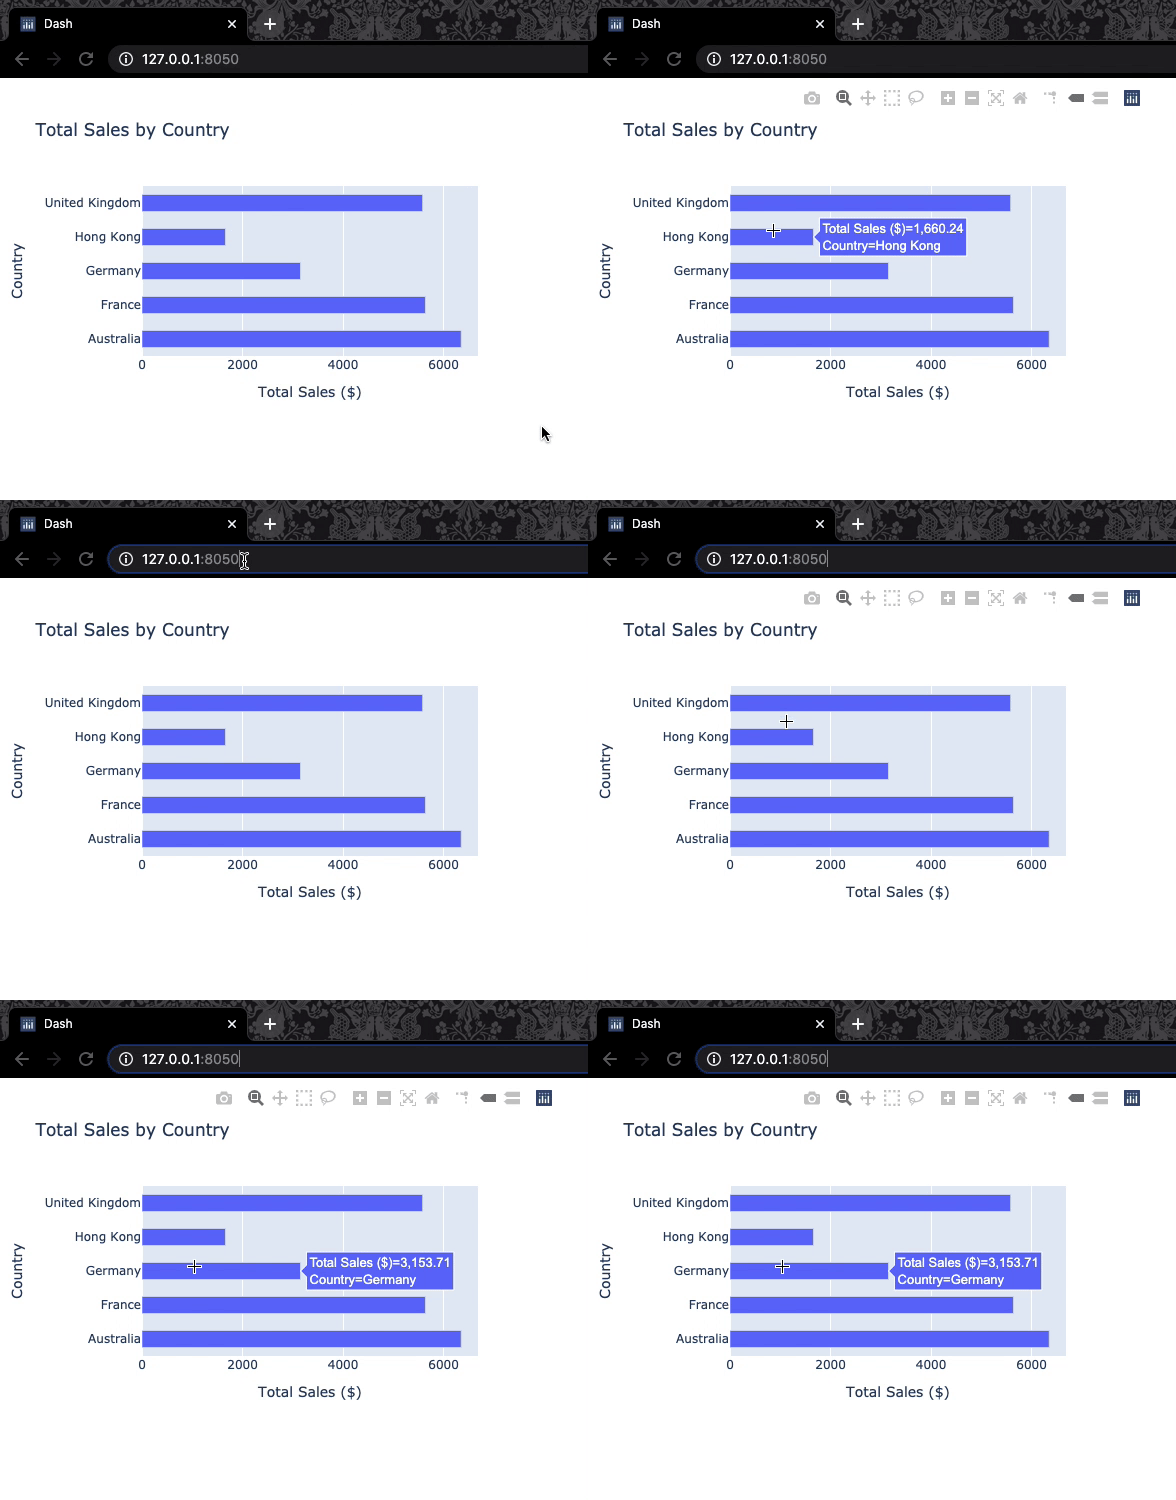
通过浏览器访问,如 Google Chrome
服务运行时,更新并保存
.py文件,可在浏览器实时查看变化

浏览器中的应用
DataCamp 中的 Dash
- 与其他 DataCamp 练习的差异:
- 练习顶部有设置代码
- 一次性整体执行(非逐行)
- 代码更长
- 完整可用的仪表盘(可展开窗口查看)

使用 Dash 和 Plotly 构建仪表板
Alex Scriven
Data Scientist
通过浏览器访问,如 Google Chrome
服务运行时,更新并保存 .py 文件,可在浏览器实时查看变化

