平行斜率线性回归

Python 中级回归:使用 statsmodels

Maarten Van den Broeck

Content Developer at DataCamp

前置课程

本课程假设你已学习:用 Python 的 statsmodels 入门回归

Python 中级回归:使用 statsmodels

从简单回归到多元回归

多元回归是含多个自变量的回归模型。

更多自变量可带来更深入洞察和更佳预测。

Python 中级回归:使用 statsmodels

课程内容

第 1 章

  • "平行斜率"回归

第 2 章

  • 交互项
  • 辛普森悖论

第 3 章

  • 更多自变量
  • 线性回归的原理

第 4 章

  • 多元逻辑回归
  • 逻辑分布
  • 逻辑回归的原理
Python 中级回归:使用 statsmodels

鱼类数据集

mass_g length_cm species
242.0 23.2 Bream
5.9 7.5 Perch
200.0 30.0 Pike
40.0 12.9 Roach
  • 每行代表一条鱼
  • mass_g 为响应变量
  • 1 个数值、1 个分类型自变量
Python 中级回归:使用 statsmodels

一次只用一个自变量

from statsmodels.formula.api import ols

mdl_mass_vs_length = ols("mass_g ~ length_cm",
                         data=fish).fit()
print(mdl_mass_vs_length.params)
Intercept   -536.223947
length_cm     34.899245
dtype: float64
  • 1 个截距系数
  • 1 个斜率系数
mdl_mass_vs_species = ols("mass_g ~ species + 0",
                          data=fish).fit()

print(mdl_mass_vs_species.params)
species[Bream]    617.828571
species[Perch]    382.239286
species[Pike]     718.705882
species[Roach]    152.050000
dtype: float64
  • 每个类别 1 个截距系数
Python 中级回归:使用 statsmodels

同时使用两个自变量

mdl_mass_vs_both = ols("mass_g ~ length_cm + species + 0",
                       data=fish).fit()
print(mdl_mass_vs_both.params)
species[Bream]    -672.241866
species[Perch]    -713.292859
species[Pike]    -1089.456053
species[Roach]    -726.777799
length_cm           42.568554
dtype: float64
  • 1 个斜率系数
  • 每个类别 1 个截距系数
Python 中级回归:使用 statsmodels

比较系数

print(mdl_mass_vs_length.params)
Intercept   -536.223947
length_cm     34.899245
print(mdl_mass_vs_both.params)
species[Bream]    -672.241866
species[Perch]    -713.292859
species[Pike]    -1089.456053
species[Roach]    -726.777799
length_cm           42.568554
print(mdl_mass_vs_species.params)
species[Bream]    617.828571
species[Perch]    382.239286
species[Pike]     718.705882
species[Roach]    152.050000
Python 中级回归:使用 statsmodels

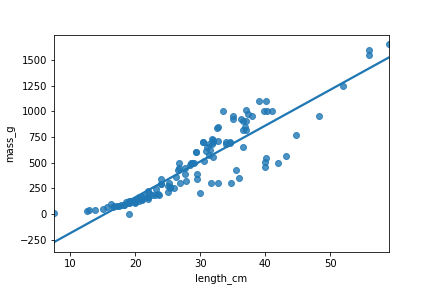
可视化:1 个数值型自变量

import matplotlib.pyplot as plt
import seaborn as sns

sns.regplot(x="length_cm",
            y="mass_g",
            data=fish,
            ci=None)

plt.show()

鱼的质量与长度的散点图,含线性趋势线

Python 中级回归:使用 statsmodels

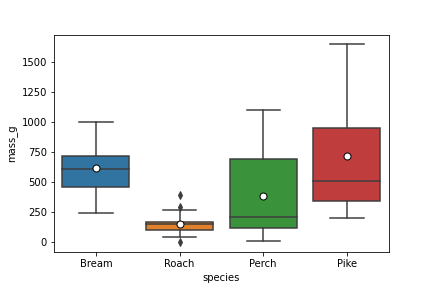
可视化:1 个分类型自变量

sns.boxplot(x="species",
            y="mass_g",
            data=fish,
            showmeans=True)

各物种鱼的质量箱线图

Python 中级回归:使用 statsmodels

可视化:两个自变量

coeffs = mdl_mass_vs_both.params
print(coeffs)
species[Bream]    -672.241866
species[Perch]    -713.292859
species[Pike]    -1089.456053
species[Roach]    -726.777799
length_cm           42.568554
ic_bream, ic_perch, ic_pike, ic_roach, sl = coeffs
sns.scatterplot(x="length_cm",
                y="mass_g",
                hue="species",
                data=fish)
plt.axline(xy1=(0, ic_bream), slope=sl, color="blue")
plt.axline(xy1=(0, ic_perch), slope=sl, color="green")
plt.axline(xy1=(0, ic_pike), slope=sl, color="red")
plt.axline(xy1=(0, ic_roach), slope=sl, color="orange")
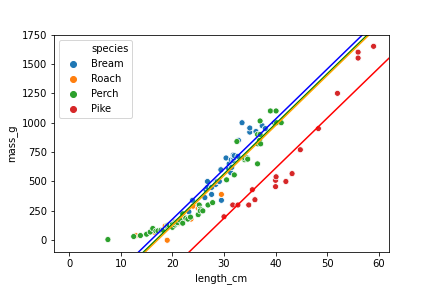
按物种分类的鱼质量与长度的平行斜率模型

Python 中级回归:使用 statsmodels

开始练习吧!

Python 中级回归:使用 statsmodels

Preparing Video For Download...