Python 中级回归:使用 statsmodels
Maarten Van den Broeck
Content Developer at DataCamp
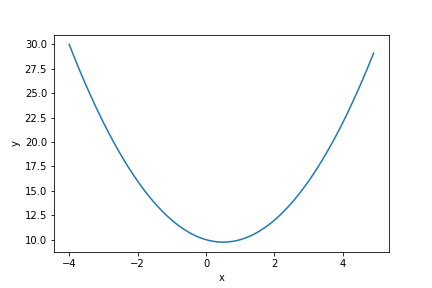
二次方程的折线图
x = np.arange(-4, 5, 0.1)
y = x ** 2 - x + 10

xy_data = pd.DataFrame({"x": x,
                        "y": y})

sns.lineplot(x="x",
             y="y",
             data=xy_data)
$y = x ^ 2 - x + 10$
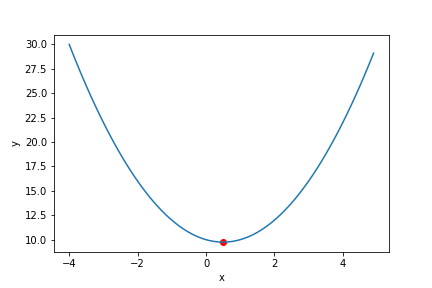
$\frac{\partial y}{\partial x} = 2 x - 1$
$0 = 2 x - 1$
$x = 0.5$
$y = 0.5 ^ 2 - 0.5 + 10 = 9.75$
若暂时不明白也没关系,练习中不会用到。
from scipy.optimize import minimize
def calc_quadratic(x):
  y = x ** 2 - x + 10
  return y
minimize(fun=calc_quadratic,
         x0=3)
      fun: 9.75
 hess_inv: array([[0.5]])
      jac: array([0.])
  message: 'Optimization terminated successfully.'
     nfev: 6
      nit: 2
     njev: 3
   status: 0
  success: True
        x: array([0.49999998])
定义一个函数来计算平方和指标。
调用 minimize(),求使该函数最小的系数。
minimize()
def calc_sum_of_squares(coeffs):
  intercept, slope = coeffs
  # More calculation!
minimize(
  fun=calc_sum_of_squares,
  x0=0
)