解读网格搜索输出

Python 中的超参数调优

Alex Scriven

Data Scientist

分析输出

让我们分析 GridSearchCV 的输出。

GridSearchCV 属性分三组:

  • 结果日志
    • cv_results_
  • 最佳结果
    • best_index_best_params_best_score_
  • 其他信息
    • scorer_n_splits_refit_time_
Python 中的超参数调优

访问对象属性


通过点号访问属性。

例如:

grid_search_object.property

其中 property 是要获取的实际属性。

Python 中的超参数调优

.cv_results_ 属性

cv_results_ 属性:

读入 DataFrame 以便打印和分析:

cv_results_df = pd.DataFrame(grid_rf_class.cv_results_)

print(cv_results_df.shape)

(12, 23)

  • 12 行对应网格中的 12 个方格/运行的 12 个模型
Python 中的超参数调优

.cv_results_ 的 'time' 各列

time 各列表示拟合(和评分)模型所用时间。

进行了 5 折交叉验证,因此运行 5 次,并存储了秒级的平均值和标准差。
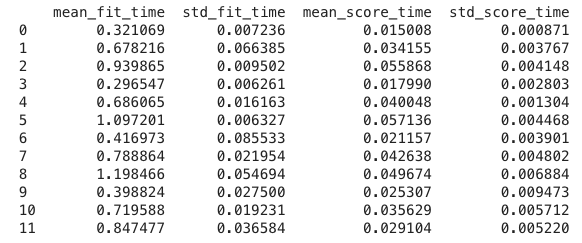
时间列

Python 中的超参数调优

.cv_results_ 的 'param_' 各列


param_ 各列存放该行测试用的参数,每个参数一列。
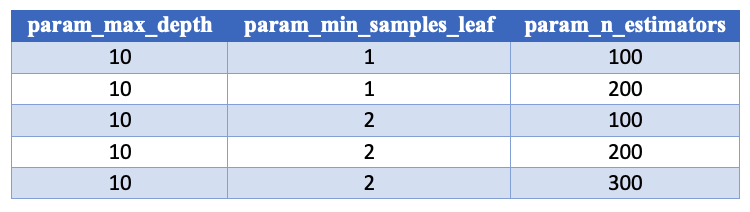
参数列

Python 中的超参数调优

.cv_results_ 的 'params' 列

params 列包含所有参数的字典:

pd.set_option("display.max_colwidth", -1)
print(cv_results_df.loc[:, "params"])
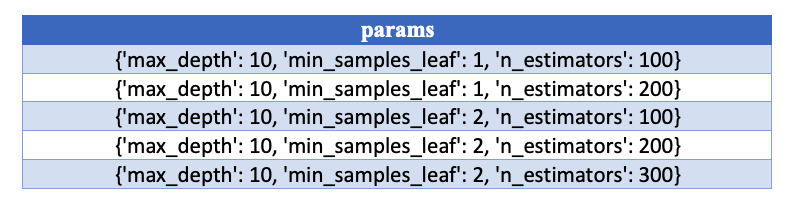
params 列

Python 中的超参数调优

.cv_results_ 的 'test_score' 各列


test_score 各列给出每个折的测试集得分及汇总统计:
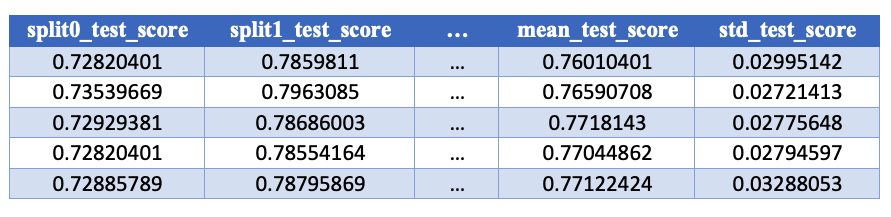
测试得分

Python 中的超参数调优

.cv_results_ 的 'rank_test_score' 列


rank 列按 mean_test_score 从高到低排序:
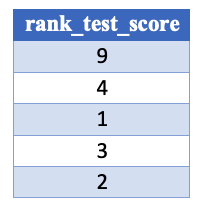
排名 测试得分

Python 中的超参数调优

提取最佳行


可用 rank_test_score 列从 cv_results_ 轻松选出最佳网格:

best_row = cv_results_df[cv_results_df["rank_test_score"] == 1]
print(best_row)

最佳行

Python 中的超参数调优

.cv_results_ 的 'train_score' 各列

随后会有对应的 training_scores 各列,结构与 test_score 相同。

需注意:

  • 需将 return_train_score 设为 True 才会包含训练分数列。

  • 训练分数没有排名列,我们只关心测试集表现。

Python 中的超参数调优

最佳网格


最佳网格的信息汇总在以下三个属性:

  • best_params_:取得最佳分数的参数字典。

  • best_score_:对应的最佳分数。

  • best_index_:在 cv_results_.rank_test_score 中对应的行号。

Python 中的超参数调优

best_estimator_ 属性


best_estimator_ 是使用网格搜索最佳参数训练得到的估计器。

这里是一个随机森林估计器:

type(grid_rf_class.best_estimator_)

sklearn.ensemble.forest.RandomForestClassifier

你也可以直接将此对象当作估计器使用。

Python 中的超参数调优

best_estimator_ 属性

print(grid_rf_class.best_estimator_)

best_estimator_ 打印输出

Python 中的超参数调优

附加信息

还有以下附加信息:

  • scorer_

用于留出集的评分函数(此处设为 AUC)。

  • n_splits_

交叉验证的折数(此处为 5)。

  • refit_time_

在全数据上重拟合最佳模型所用秒数。

Python 中的超参数调优

开始练习吧!

Python 中的超参数调优

Preparing Video For Download...