Scikit-Learn 中的随机搜索
Python 中的超参数调优

Alex Scriven
Data Scientist
对比 GridSearchCV
无需重复造轮子。回顾网格搜索步骤:
- 选择算法/估计器
- 定义要调的超参数
- 为每个超参数设定取值范围
- 设定交叉验证方案
- 定义评分函数
- 加入其他有用信息或函数
对比网格搜索
只有一个区别:
- 第 7 步 = 决定抽样数量(然后采样)
就是这样!(基本上)
对比 Scikit-Learn 模块
模块也很相似:
GridSearchCV:
sklearn.model_selection.GridSearchCV(estimator, param_grid,
        scoring=None, fit_params=None,
        n_jobs=None,
        refit=True, cv='warn', verbose=0,
        pre_dispatch='2*n_jobs',
        error_score='raise-deprecating',
        return_train_score='warn')
RandomizedSearchCV:
sklearn.model_selection.RandomizedSearchCV(estimator,
        param_distributions, n_iter=10,
        scoring=None, fit_params=None,
        n_jobs=None, refit=True,
        cv='warn', verbose=0,
        pre_dispatch='2*n_jobs',
        random_state=None,
        error_score='raise-deprecating',
        return_train_score='warn')
关键区别
两个关键区别:
n_iter:随机搜索从网格中抽取的样本数。前一示例中你做了 300 次。param_distributions与param_grid略有不同,可选设置采样分布。- 默认是所有组合被选中的概率相同。
构建 RandomizedSearchCV 对象
现在我们可像网格搜索一样构建随机搜索对象,但做一个小改动:
# Set up the sample space learn_rate_list = np.linspace(0.001,2,150) min_samples_leaf_list = list(range(1,51)) # Create the grid parameter_grid = { 'learning_rate' : learn_rate_list, 'min_samples_leaf' : min_samples_leaf_list}# Define how many samples number_models = 10
构建 RandomizedSearchCV 对象
现在我们可以构建该对象:
# Create a random search object
random_GBM_class = RandomizedSearchCV(
    estimator = GradientBoostingClassifier(),
    param_distributions = parameter_grid,
    n_iter = number_models,
    scoring='accuracy',
    n_jobs=4,
    cv = 10,
    refit=True,
    return_train_score = True)
# Fit the object to our data
random_GBM_class.fit(X_train, y_train)
分析输出
输出与之前完全相同!
如何查看被选中的超参数?
在 cv_results_ 字典中的相应 param_ 列!
提取列表:
rand_x = list(random_GBM_class.cv_results_['param_learning_rate'])
rand_y = list(random_GBM_class.cv_results_['param_min_samples_leaf'])
分析输出
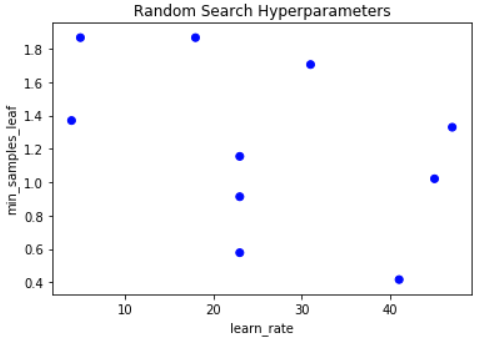
构建可视化:
# Make sure we set the limits of Y and X appriately x_lims = [np.min(learn_rate_list), np.max(learn_rate_list)] y_lims = [np.min(min_samples_leaf_list), np.max(min_samples_leaf_list)]# Plot grid results plt.scatter(rand_y, rand_x, c=['blue']*10) plt.gca().set(xlabel='learn_rate', ylabel='min_samples_leaf', title='Random Search Hyperparameters') plt.show()
分析输出
与之前相似的图:
Passons à la pratique !
Python 中的超参数调优

