正态分布简介

Python 中的统计思维(第 1 部分)

Justin Bois

Teaching Professor at the California Institute of Technology

正态分布
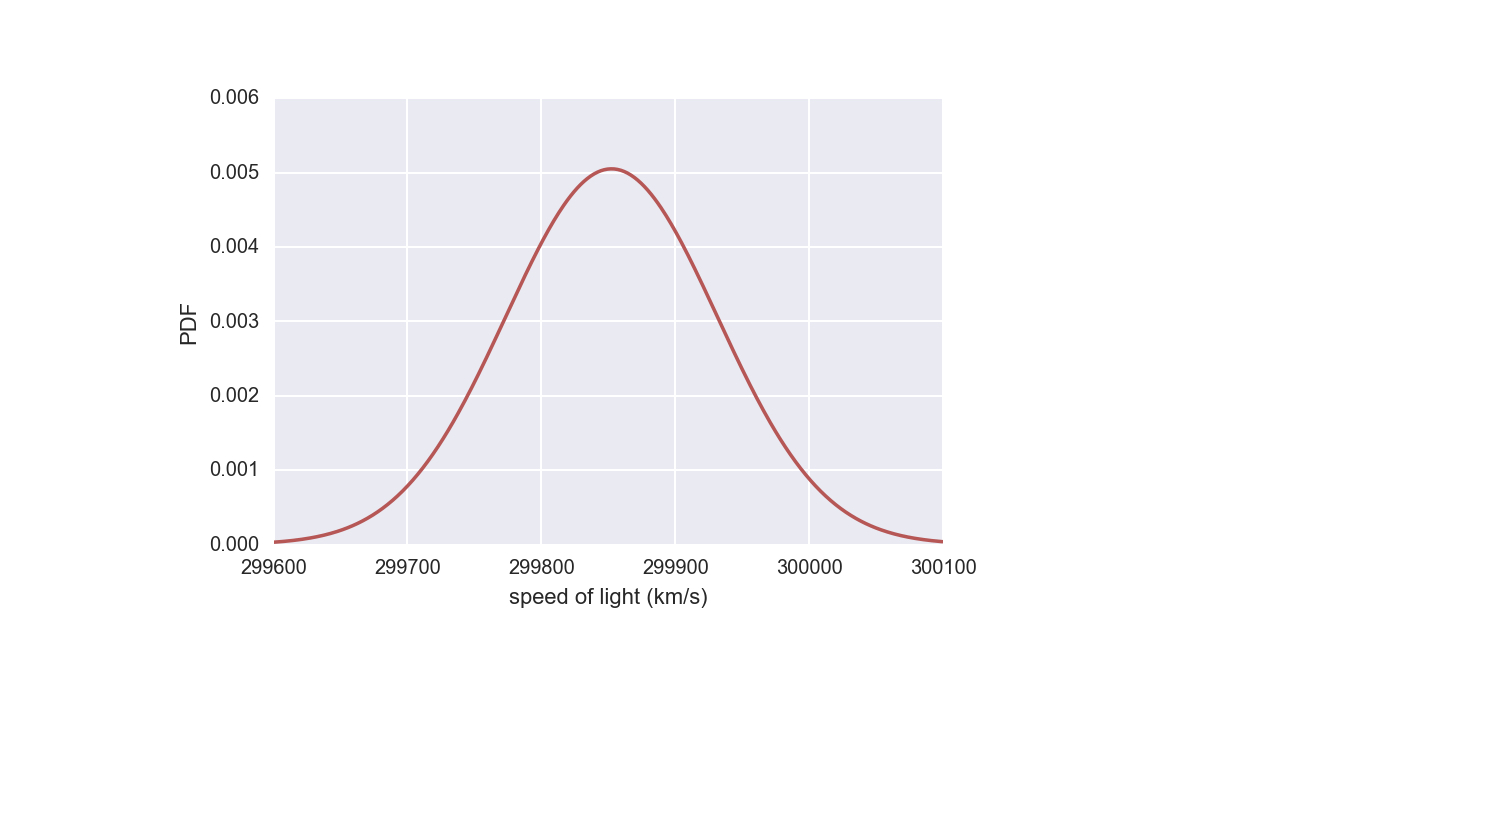
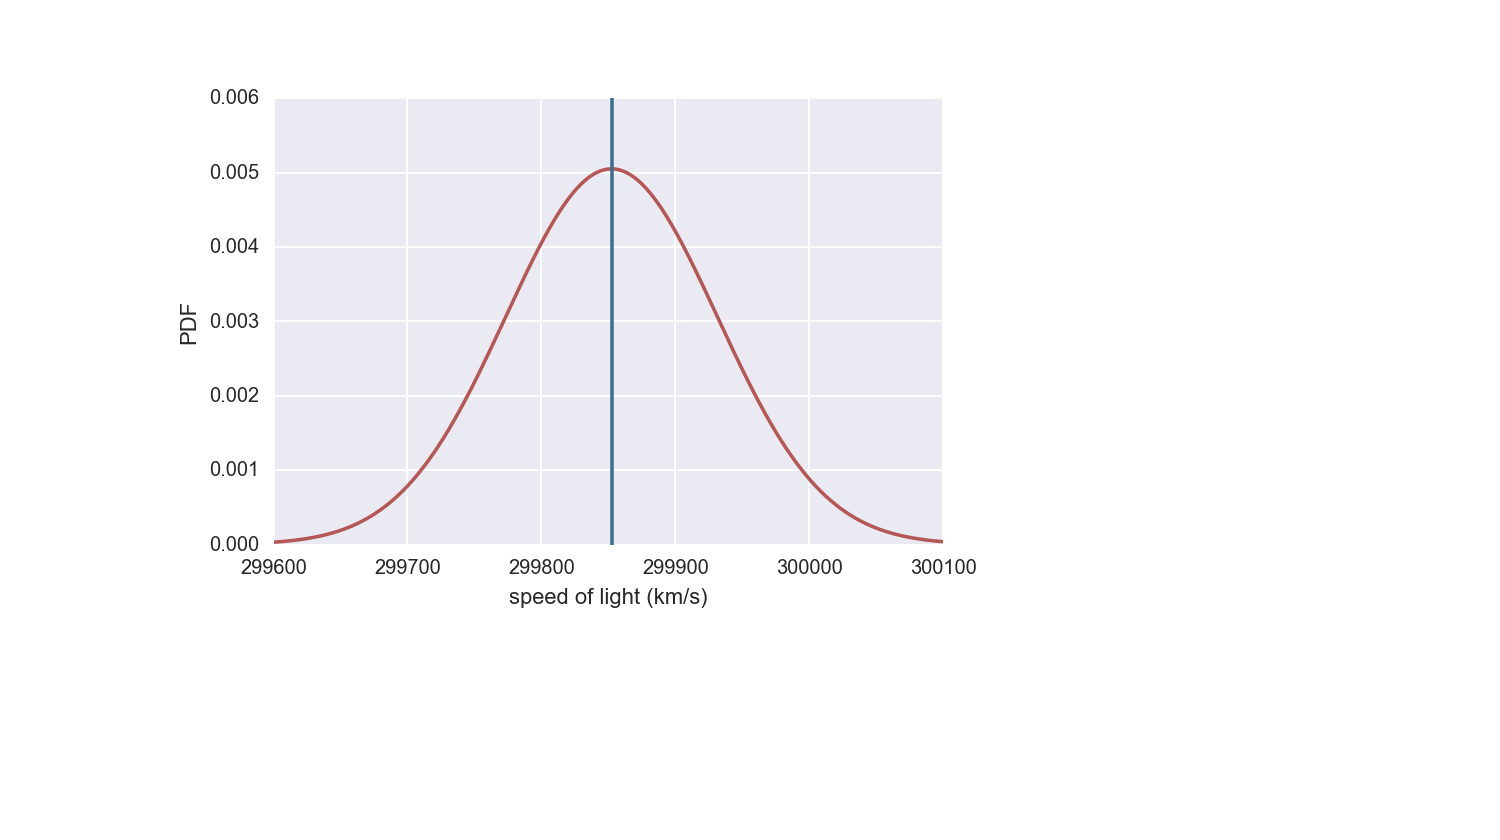
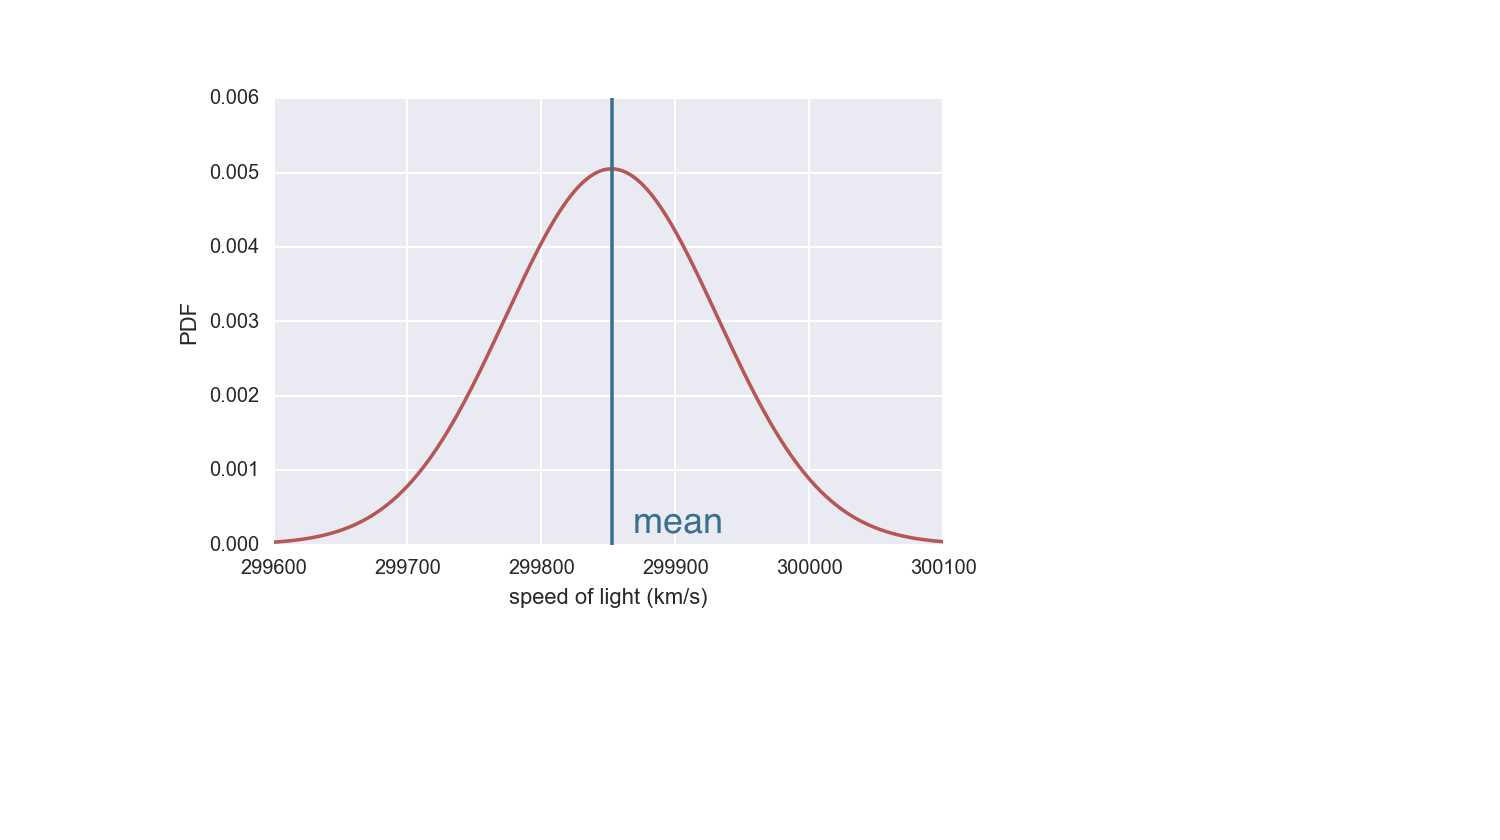
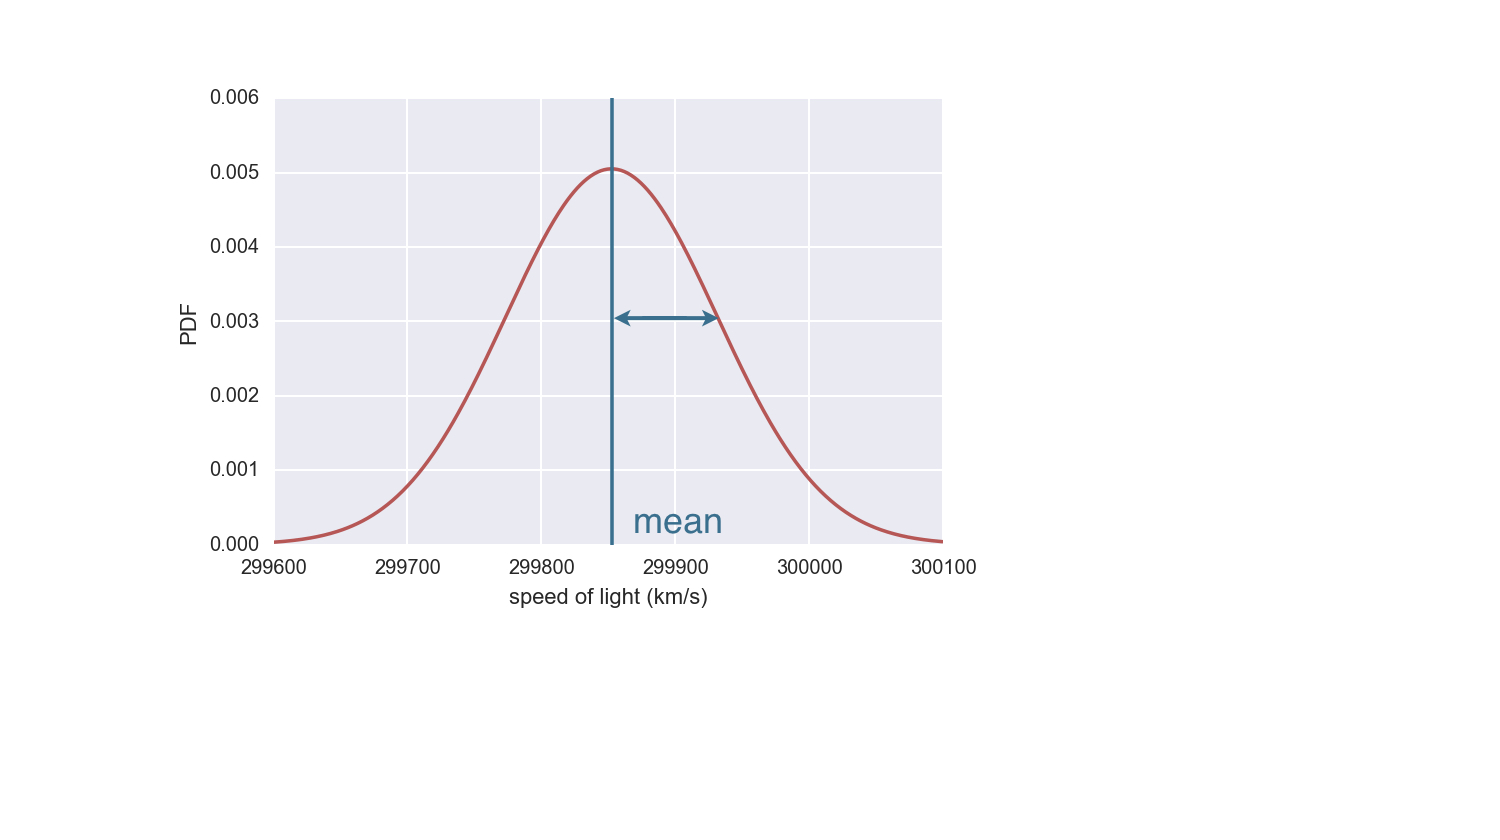
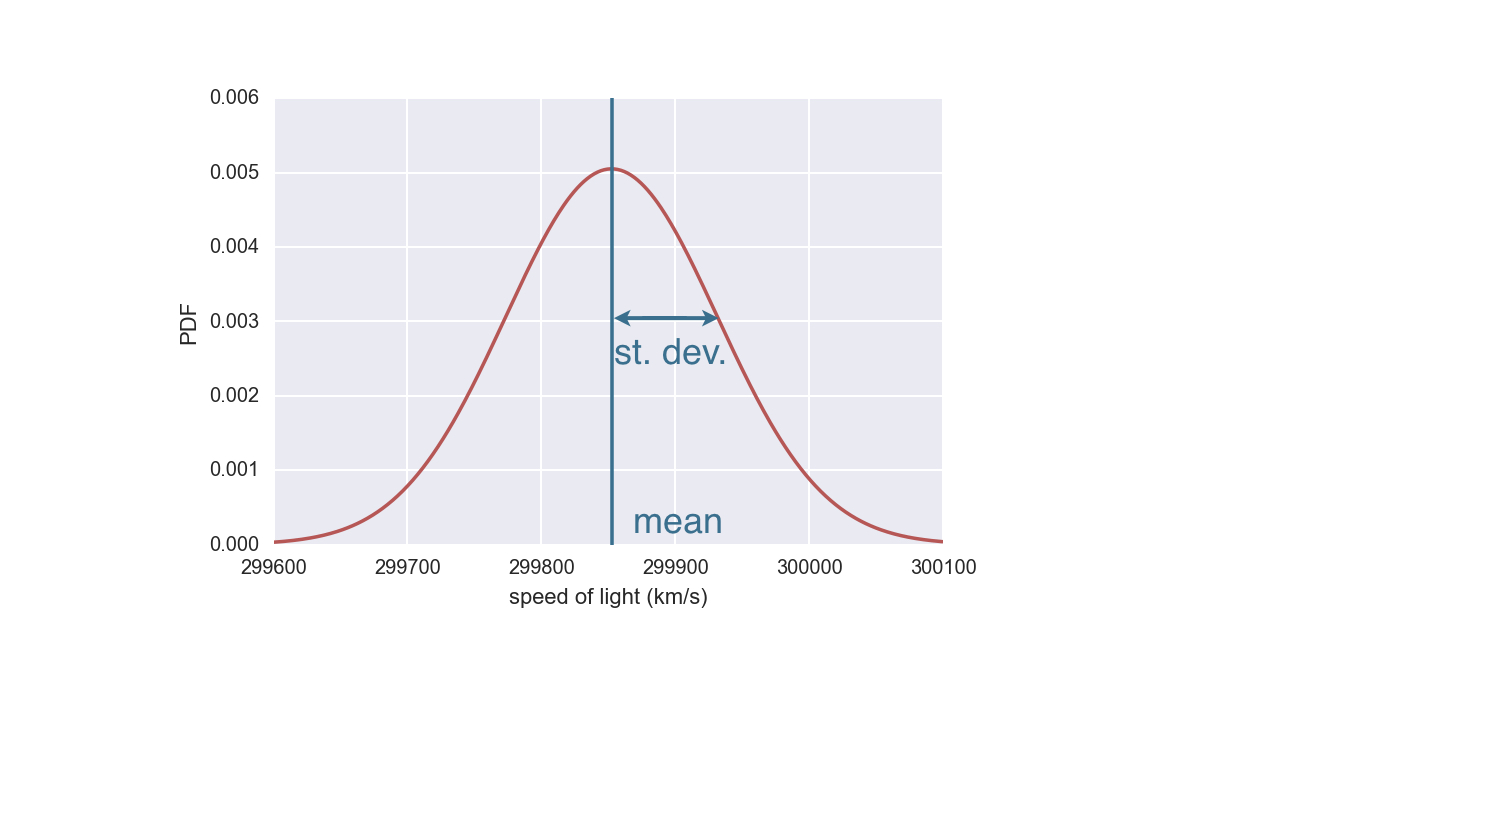
  • 描述连续变量,其 PDF 具有单个对称峰。
Python 中的统计思维(第 1 部分)

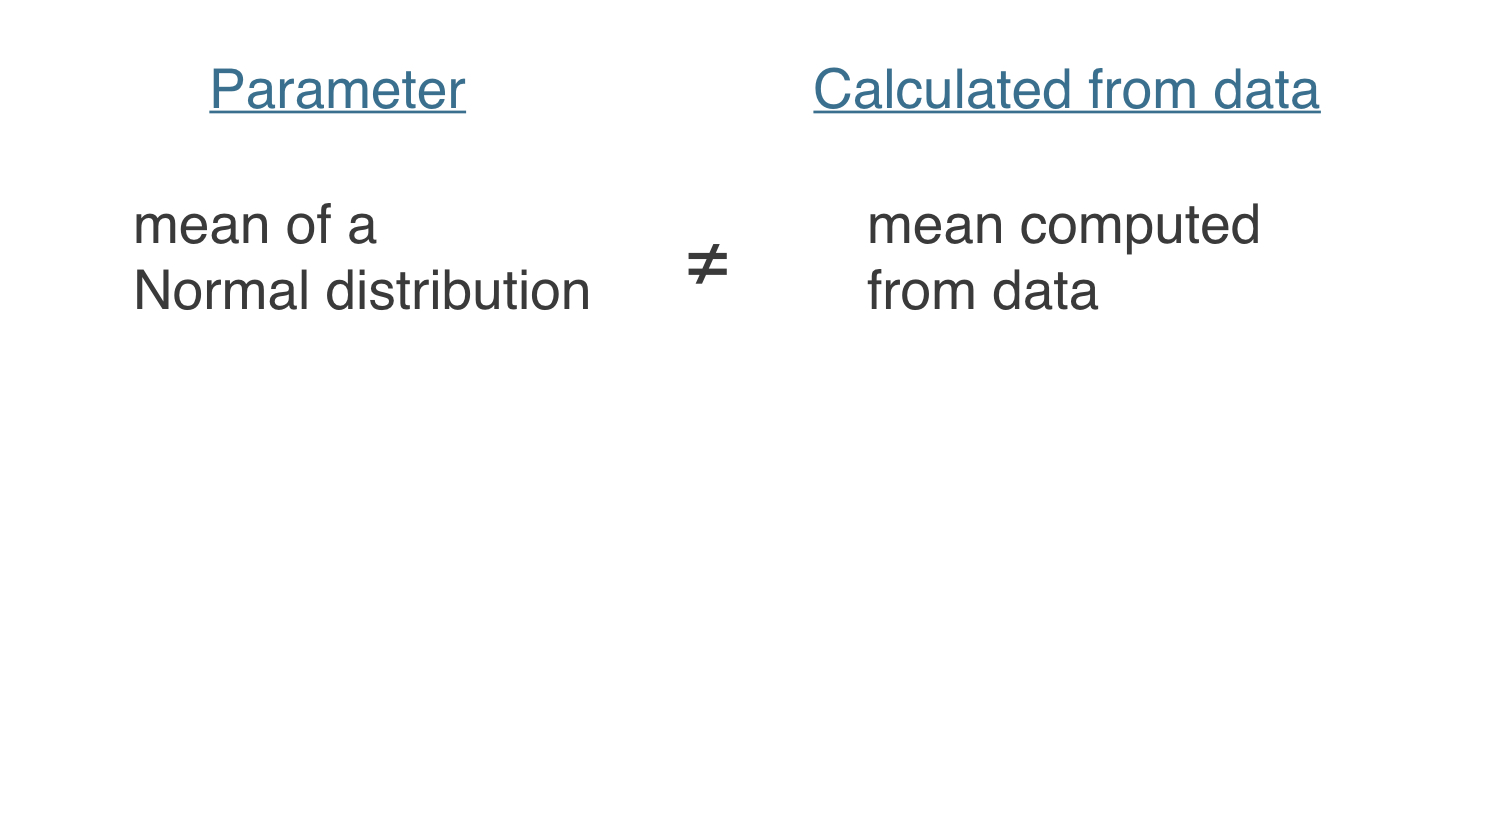
正态分布

ch4-2.004.png

Python 中的统计思维(第 1 部分)

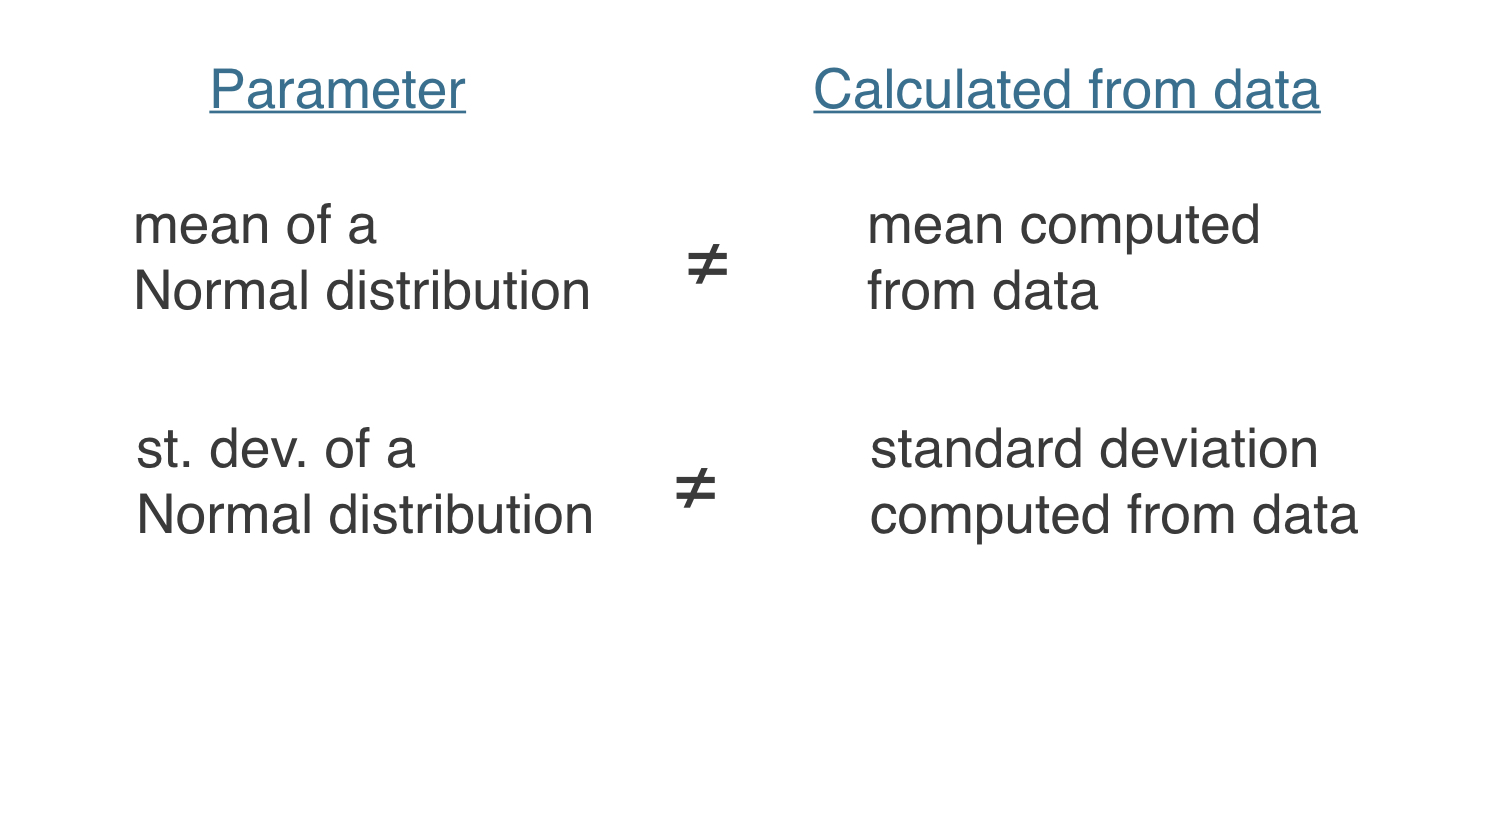
正态分布

ch4-2.005.png

Python 中的统计思维(第 1 部分)

正态分布

ch4-2.006.png

Python 中的统计思维(第 1 部分)

正态分布

ch4-2.007.png

Python 中的统计思维(第 1 部分)

正态分布

ch4-2.008.png

Python 中的统计思维(第 1 部分)

ch4-2.009.png

Python 中的统计思维(第 1 部分)

ch4-2.010.png

Python 中的统计思维(第 1 部分)

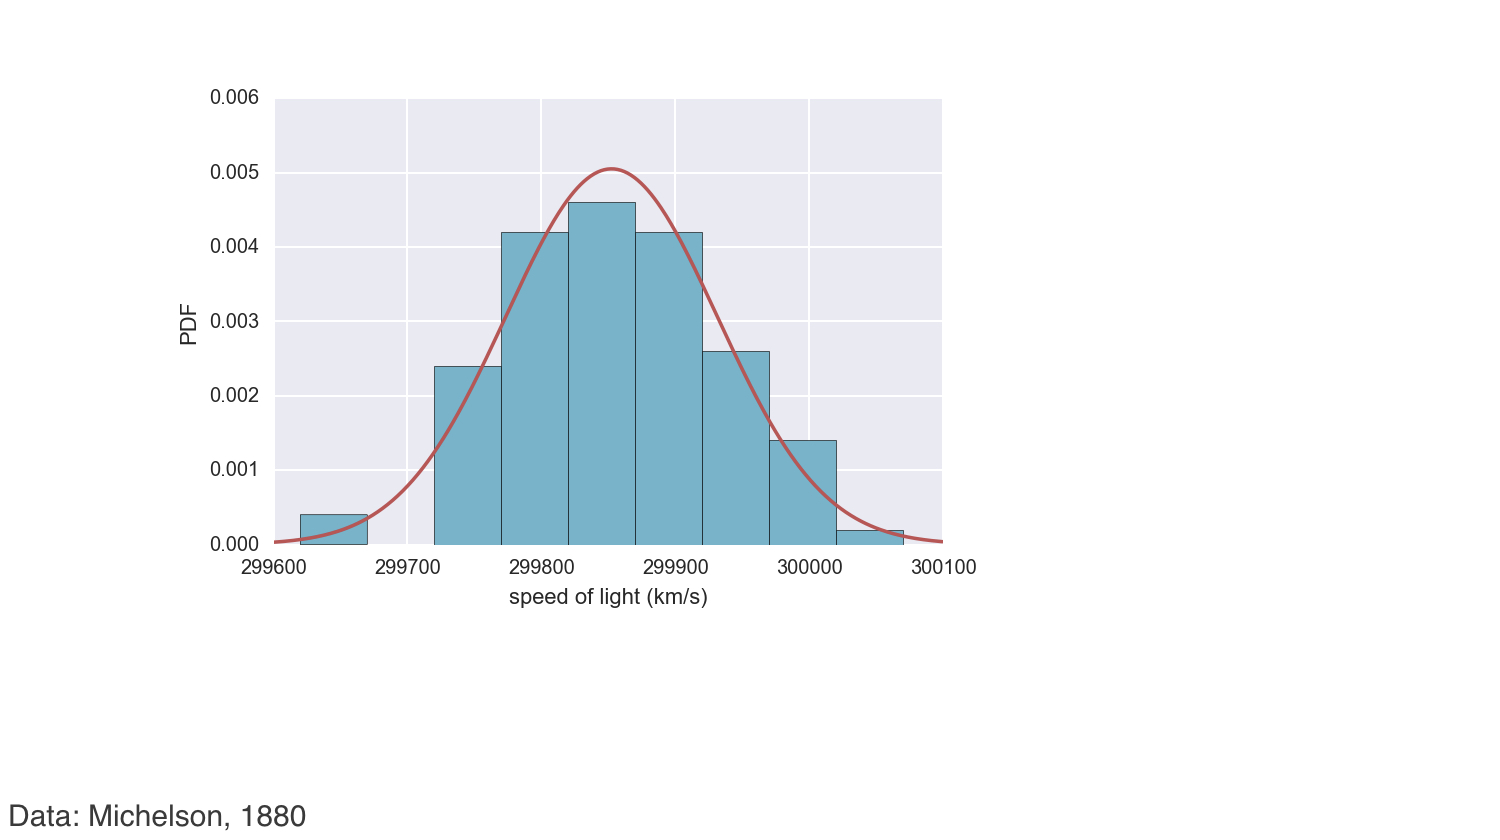
将数据与正态 PDF 比较

ch4-2.012.png

Python 中的统计思维(第 1 部分)

检验迈克尔逊数据的正态性

import numpy as np
rng = np.random.default_rng()
mean = np.mean(michelson_speed_of_light)
std = np.std(michelson_speed_of_light)
samples = rng.normal(mean, std, size=10000)
x, y = ecdf(michelson_speed_of_light)
x_theor, y_theor = ecdf(samples)
Python 中的统计思维(第 1 部分)

检验迈克尔逊数据的正态性

import matplotlib.pyplot as plt
import seaborn as sns
sns.set()
_ = plt.plot(x_theor, y_theor)
_ = plt.plot(x, y, marker='.', linestyle='none')
_ = plt.xlabel('speed of light (km/s)')
_ = plt.ylabel('CDF')
plt.show()
Python 中的统计思维(第 1 部分)

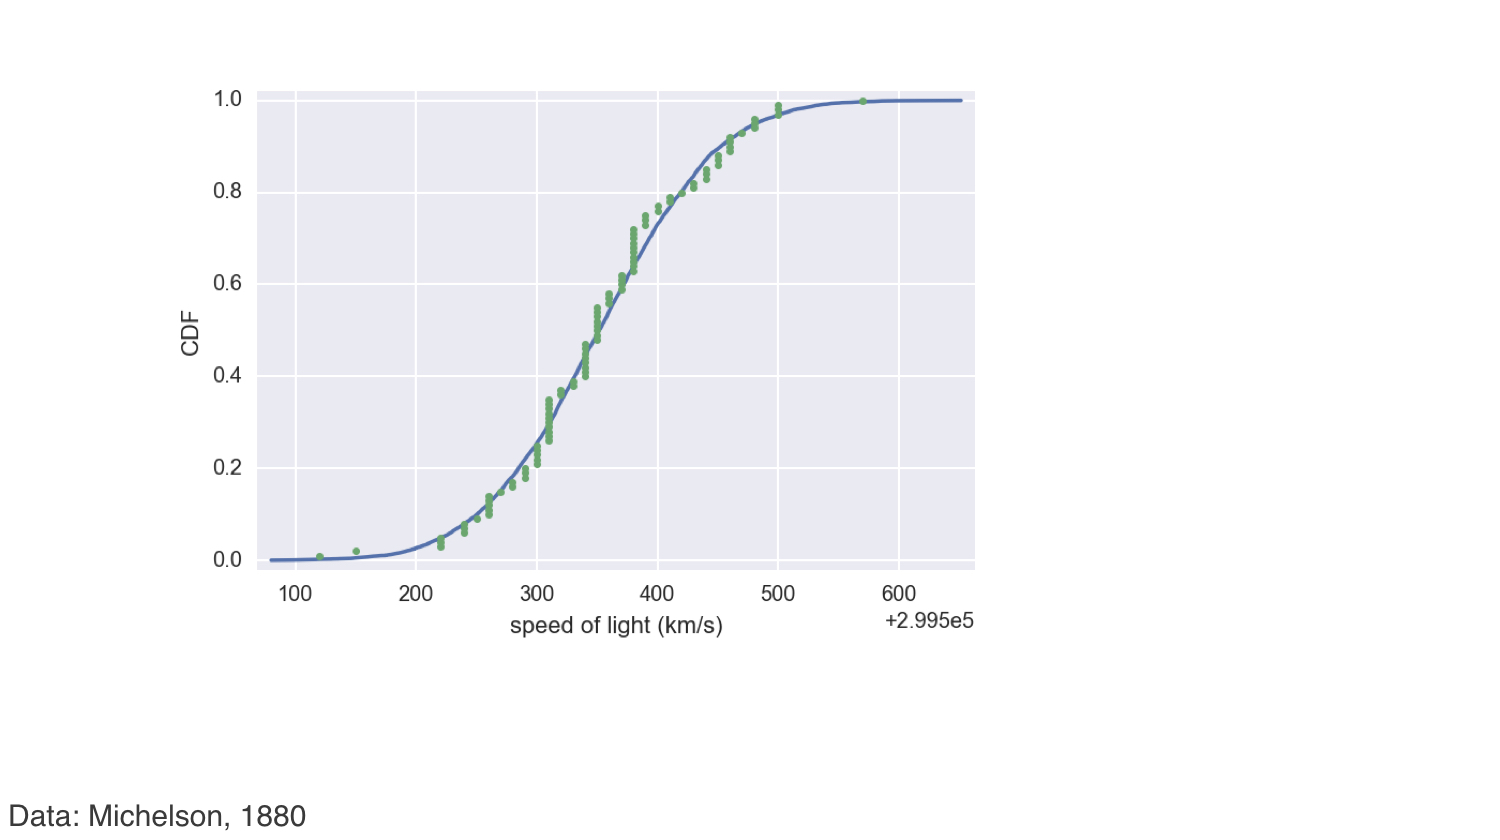
检验迈克尔逊数据的正态性

ch4-2.029.png

Python 中的统计思维(第 1 部分)

让我们来练习!

Python 中的统计思维(第 1 部分)

Preparing Video For Download...